Mexico has 30% of its land under high seismic risk
Following an article published on the seismological risk in spain, the possibility of publishing a similar story focused on Mexico arose. Mexico has a great seismic activity and has in particular an area that has attracted the attention of researchers for decades: The Guerrero Gap.
The area known as the Guerrero Gap is an 110 kilometers area long where no major earthquake has been recorded for more than a century, despite being located in a zone of high seismic activity. In a country where every year more than a thousand earthquakes of magnitude greater than 3.5 are registered, this place attracts the attention of experts: how much energy has accumulated in this place and when will it detonate?
Copala
guerrero
Acapulco
Placa de Cocos
Placa
Norteamericana
Avanza 5,4 cm al año
Brecha de
Guerrero
1
Fosa
Mesoamericana
Papanoa
2
Océano Pacífico
Zihuatanejo
Norte
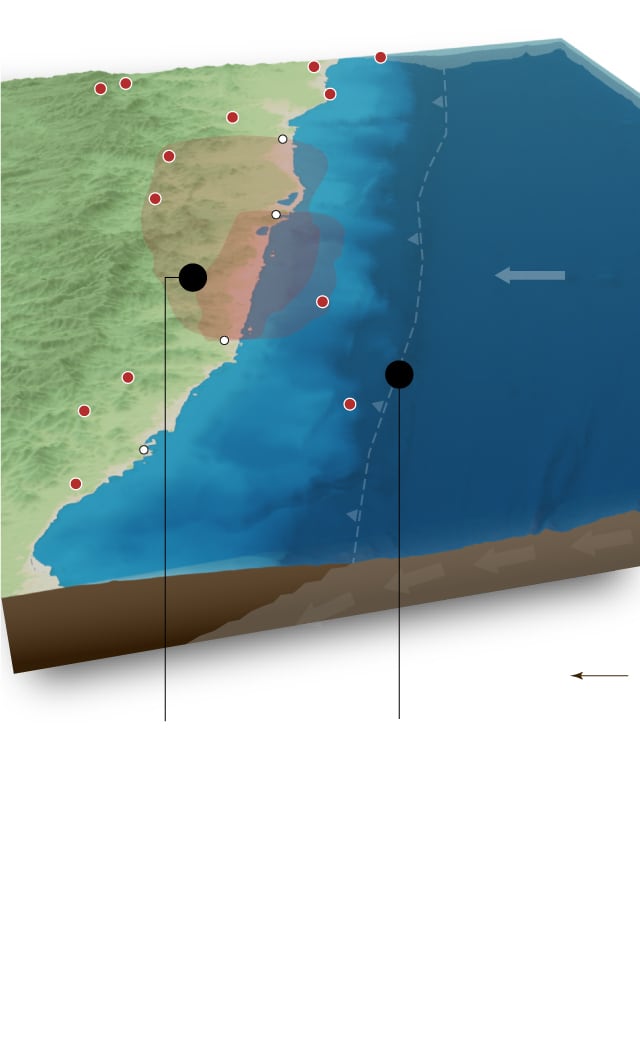
La brecha sísmica de Guerrero podría sufrir próximamente un terremoto de magnitud 7 o superior. El mapa muestra todos lo sismos () de estas características ocurridos desde 1911.
La placa Cocos se desliza bajo la placa Norteamericana (subducción). Este fenómeno genera terremotos de gran magnitud a lo largo de la fosa Mesoamericana.
Copala
guerrero
Acapulco
Placa de Cocos
Placa
Norteamericana
Avanza 5,4 cm al año
Brecha de
Guerrero
1
Fosa
Mesoamericana
Papanoa
2
Océano Pacífico
Zihuatanejo
Norte
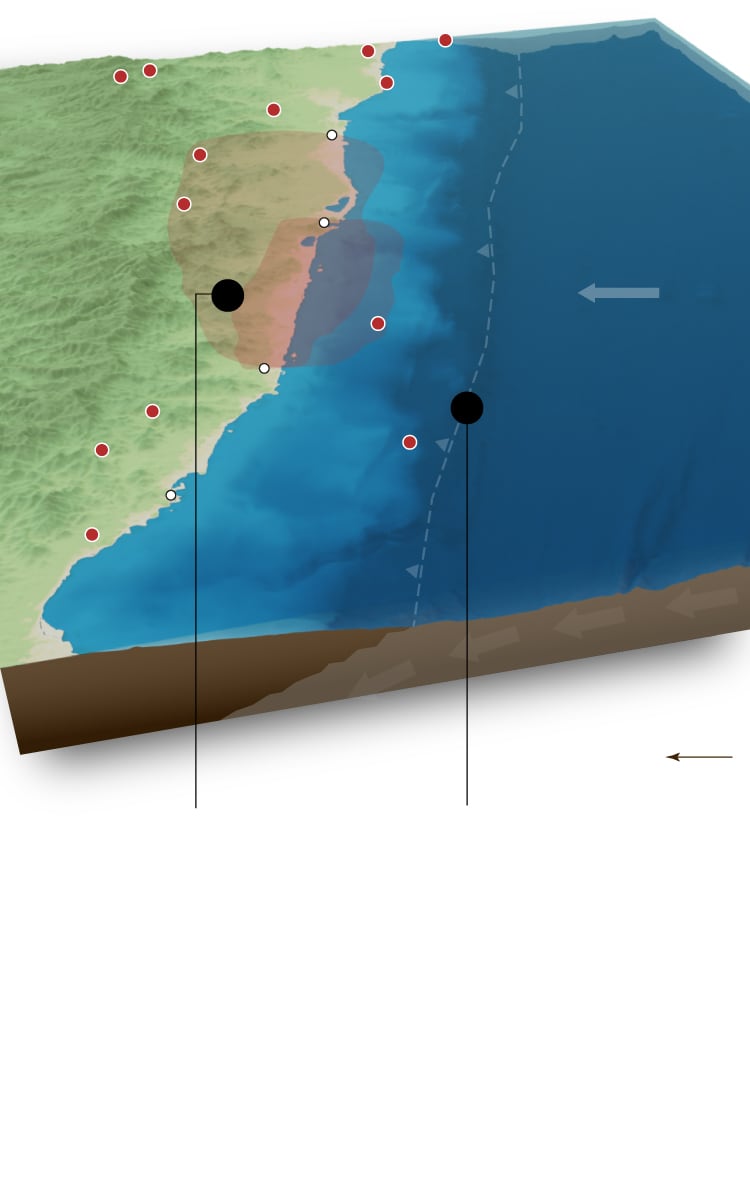
La placa Cocos se desliza bajo la placa Norteamericana (subducción). Este fenómeno genera terremotos de gran magnitud a lo largo de la fosa Mesoamericana.
La brecha sísmica de Guerrero podría sufrir próximamente un terremoto de magnitud 7 o superior. El mapa muestra todos lo sismos () de estas características ocurridos desde 1911.
Costa Chica
Copala
Placa de Cocos
7,8 (1957)
7,1 (2017)
Avanza 5,4 cm al año
230 km
Acapulco
Placa
Norteamericana
Brecha de
Guerrero
110 km
1
Fosa
Mesoamericana
Papanoa
Océano Pacífico
2
Estado de
guerrero
Zihuatanejo
Norte
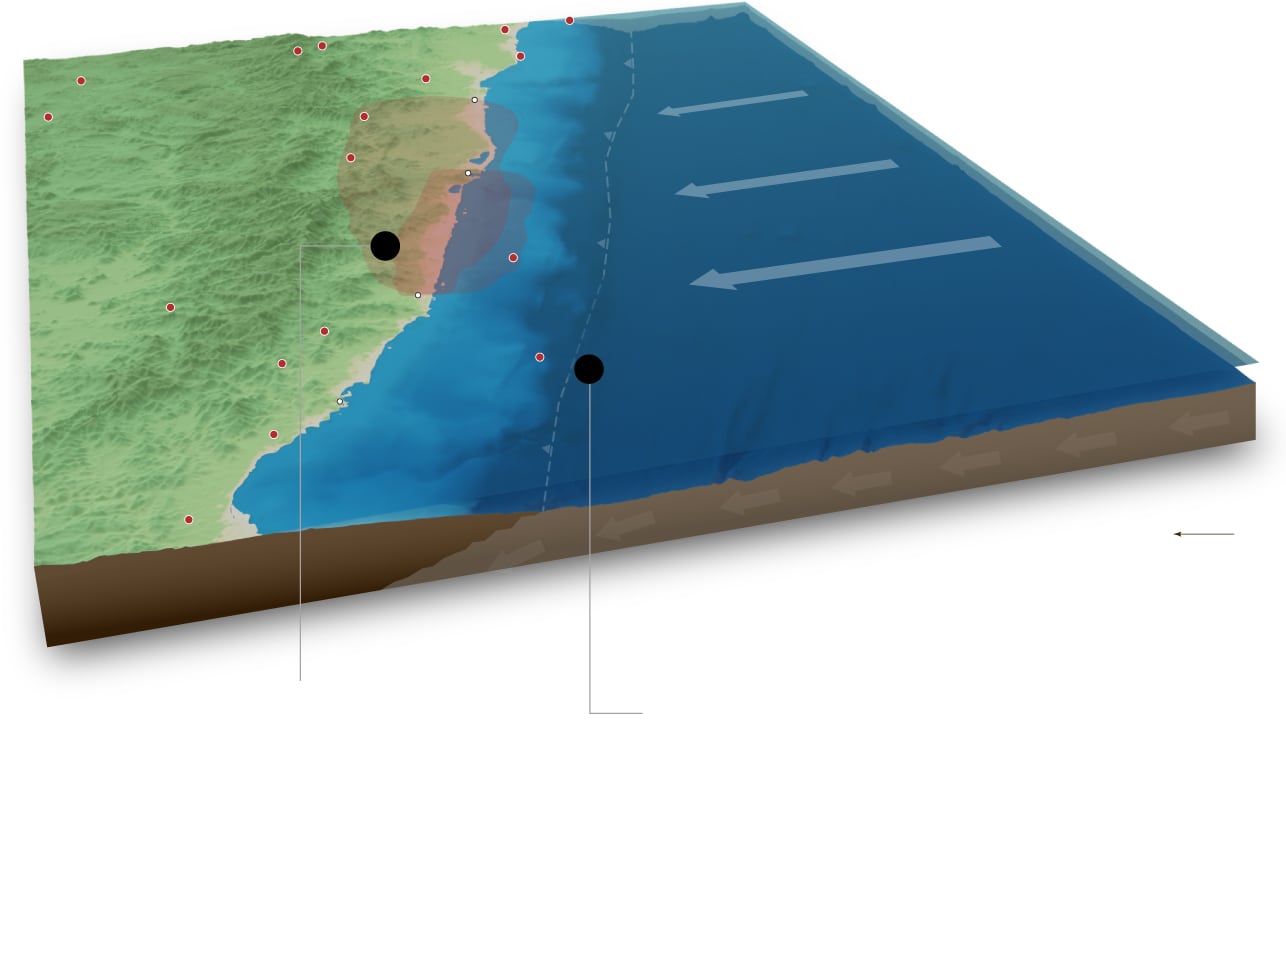
La brecha sísmica de Guerrero podría sufrir próximamente un terremoto de magnitud 7 o superior. El mapa muestra todos lo sismos () de estas características ocurridos desde 1911.
La placa Cocos se desliza bajo la placa Norteamericana en un proceso conocido como subducción. Este fenómeno genera terremotos de gran magnitud a lo largo de la fosa Mesoamericana.
Costa Chica
Sierra
7,8 (1957)
Placa de Cocos
Copala
7,1 (2017)
Avanza 5,4 cm al año
230 km
Acapulco
Placa
Norteamericana
110 km
Fosa
Mesoamericana
Brecha de
Guerrero
madre
2
7,5 (1911)
1
Papanoa
Estado de
guerrero
del
Océano Pacífico
sur
Zihuatanejo
Norte
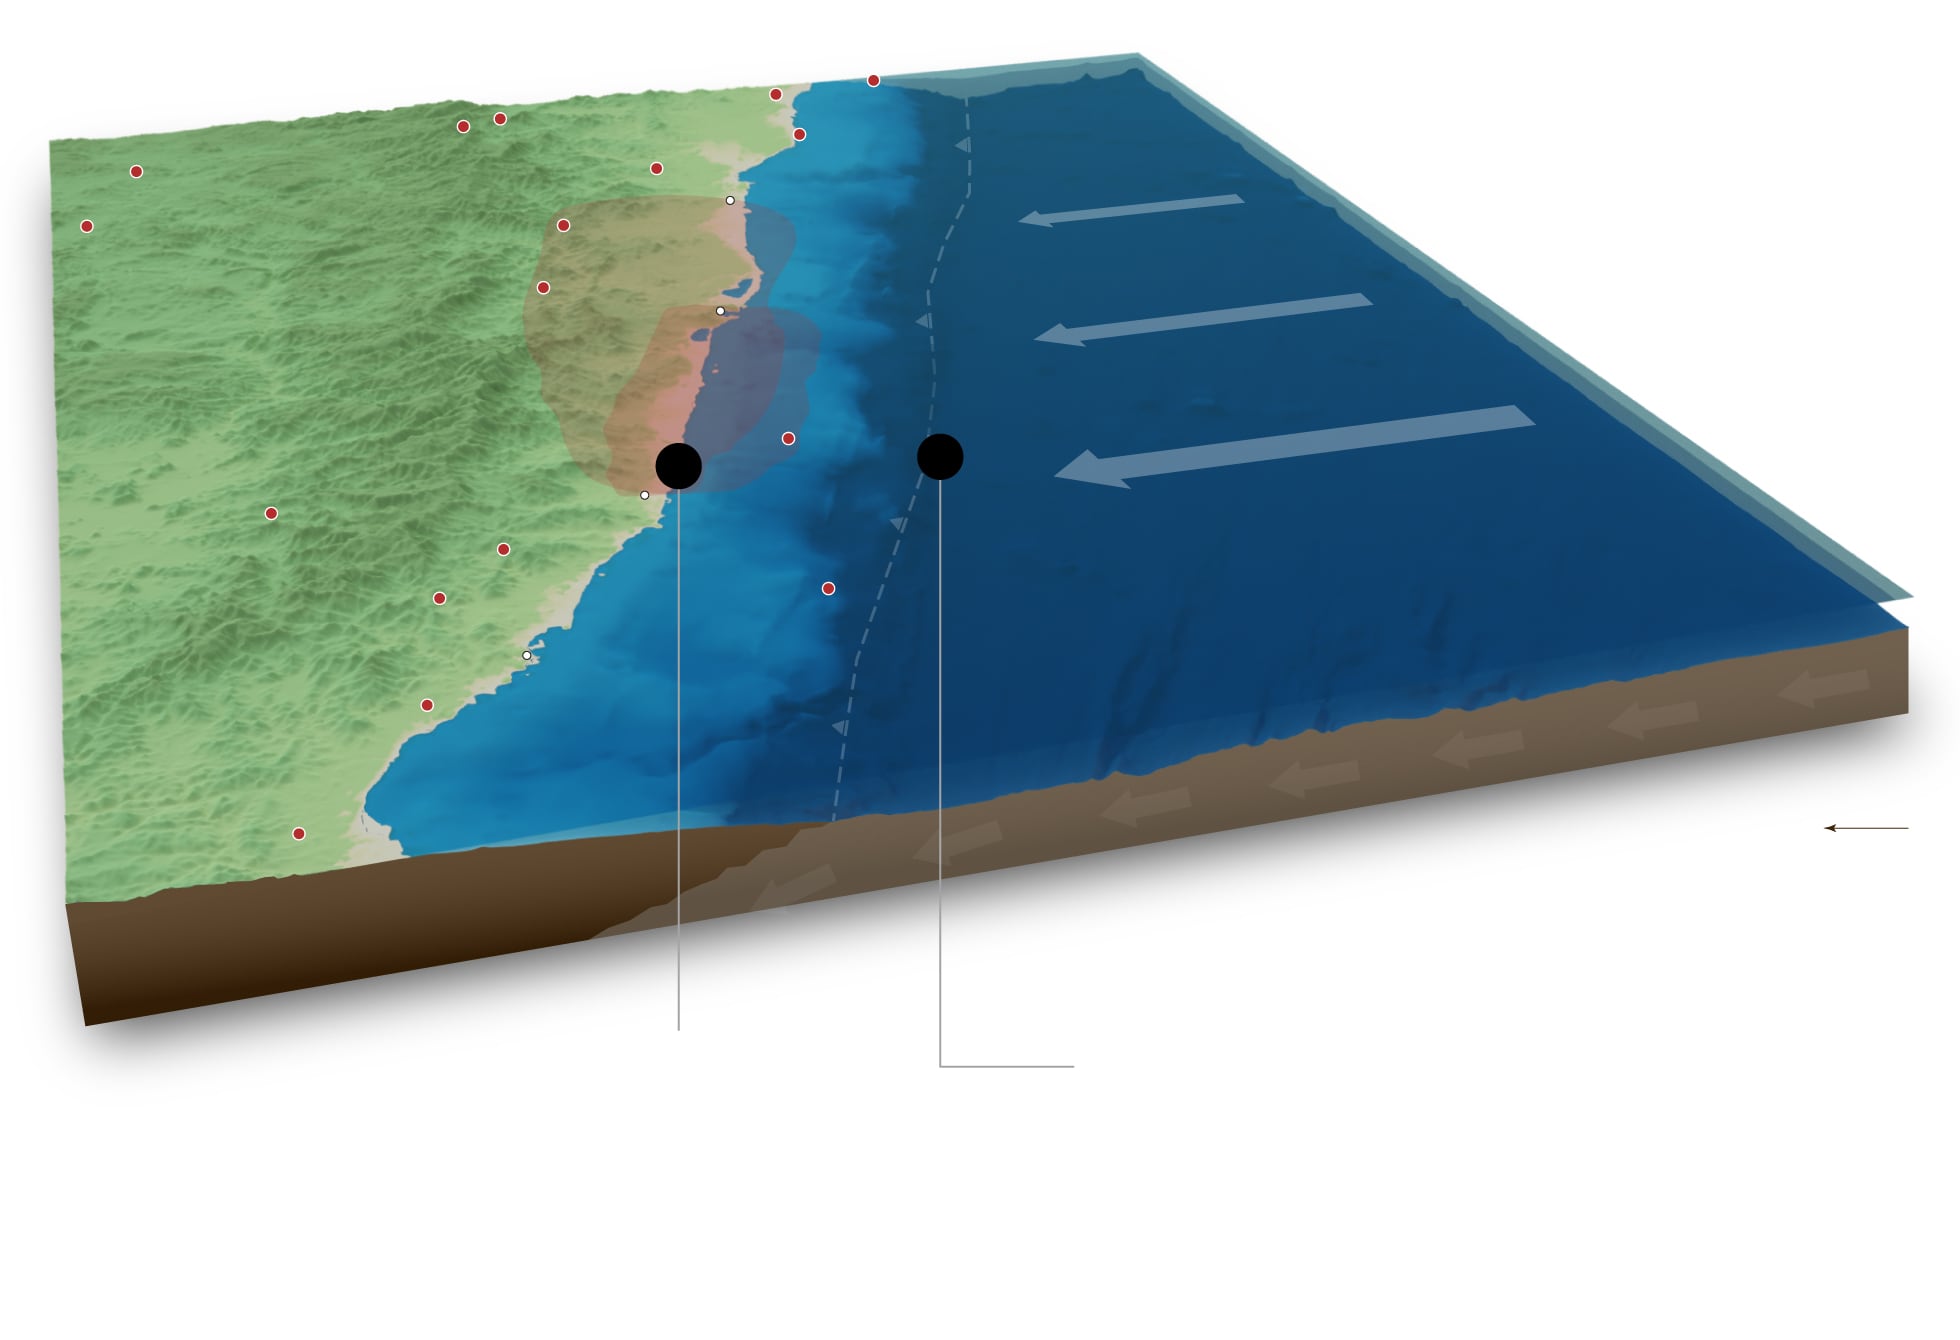
La brecha sísmica de Guerrero podría sufrir próximamente un terremoto de magnitud 7 o superior. El mapa muestra todos lo sismos () de estas características ocurridos desde 1911.
La placa Cocos se desliza bajo la placa Norteamericana en un proceso conocido como subducción. Este fenómeno genera terremotos de gran magnitud a lo largo de la fosa Mesoamericana.
This article offered me the opportunity to get my first taste of Blender. The famous software for the elaboration of three-dimensional graphics has earned a place during the last years in the field of Cartography, especially in the use of its capabilities to create a more realistic lighting than the traditional Hillshades offered by GIS software such as QGIS.
In order to create a scene with real elevation data, Blender needs a height map: a black and white image where the pixels closest to the white represent the highest altitude and the black ones the lowest. This data can come from a digital elevation model (DEM). However, a small modification of this type of file is necessary to work with it in Blender. This process is covered in depth in the best post on using Blender to create shaded reliefs: Daniel Huffman’s Creating Shaded Relief in Blender.
One of the problems I found was how to combine Elevation data with Bathymetry data. The best idea I had was to create a few functions that use GDAL to filter values above and below zero, perform a resampling to make sure that the two data sets had the same resolution and finally merge them into one file.
function filter_values(){
    file_name="${1%%.*}"
    input=${1}_clipped.tif
    calc=$2
    echo "Filtering values from ${1}..."
    gdal_calc.py \
        --quiet \
        --overwrite \
        -A $input \
        --calc=$calc \
        --outfile ${file_name}_filtered.tif
}
This function was then used as follows:
filter_values srtm "(A>0)*A"
filter_values gebco "(A<0)*A"
A resampling of the data is performed to avoid conflicts related to different resolutions:
function resample(){
    file_name="${1%%.*}"
    input=${1}_filtered.tif
    output=${file_name}_resampled.tif
    gdalwarp \
        -overwrite \
        -of GTiff -co COMPRESS=DEFLATE \
        -ts 1000 1000 \
        -r cubic \
        $input temp.tif

    gdal_translate \
        -of GTiff -a_nodata 0 \
        temp.tif $output

    rm temp.tif
}
Finally, a merge of the two files is made:
function merge_files(){
    file_name1="${1%%.*}"
    file_name2="${2%%.*}"
    input1=$1
    input2=$2
    output=srtm_gebco_merged.tif
    gdal_merge.py \
        -o temp.tif \
        -init 0 \
        $input1 $input2

    # fill no data values
    gdal_fillnodata.py temp.tif $output
    rm temp.tif
}
With these steps we get a TIFF file with bathymetry and altimetry data. Finally, I used the great blenderize script by Nick Underwood (enlace) that allows to scale the values, project to your desired CRS, etc. and get a height map ready to work in Blender.
Blender was used only in the locator map that opens the piece. In the article there are other interesting elements such as a locator of the Guerrero Gap or a large map of Mexico that collects all the earthquakes in the area during the last century.
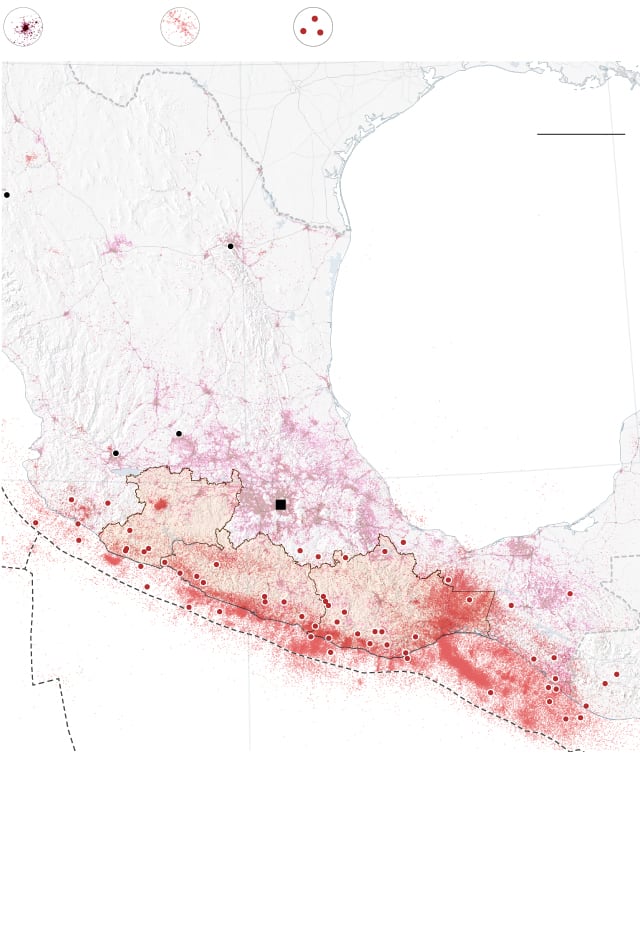
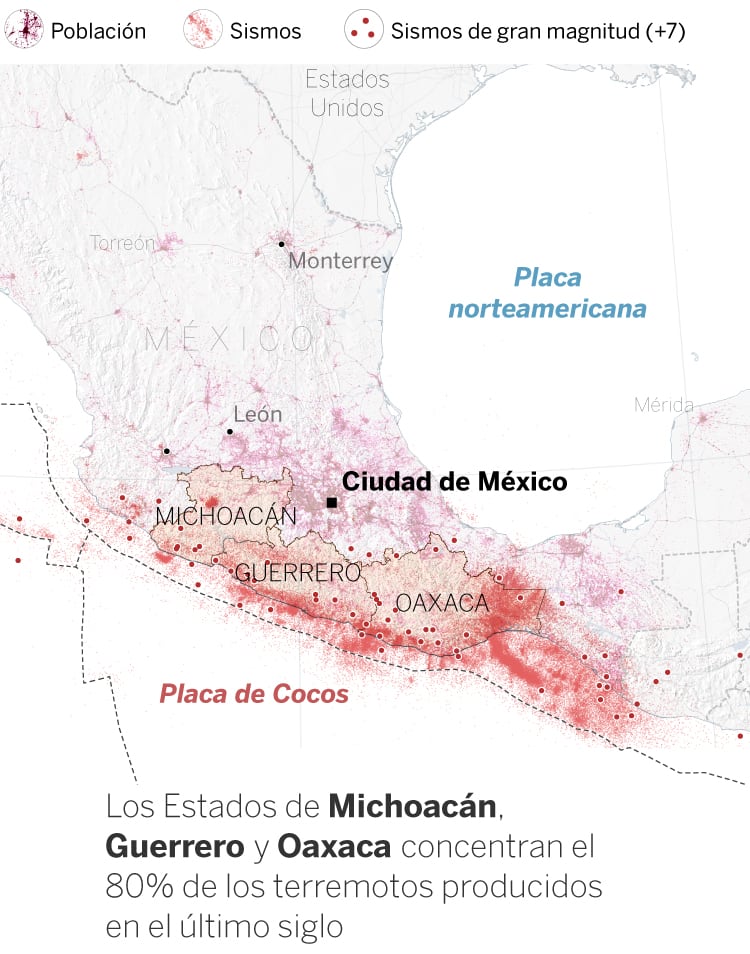
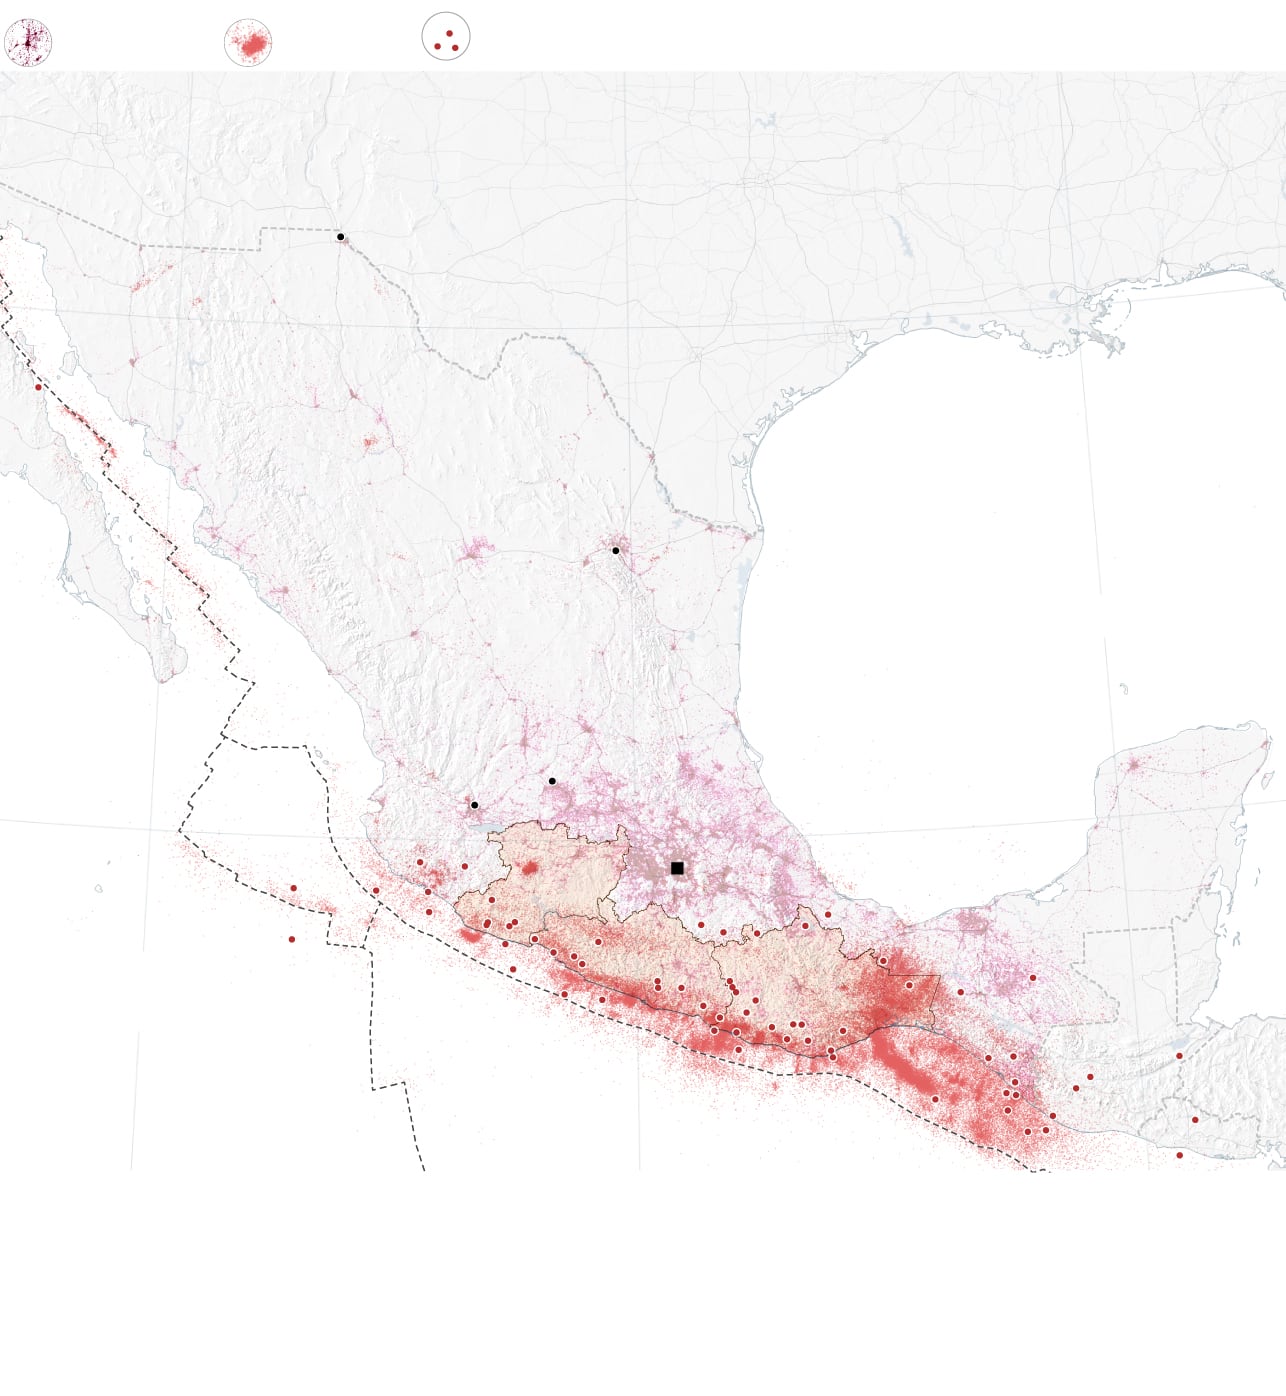
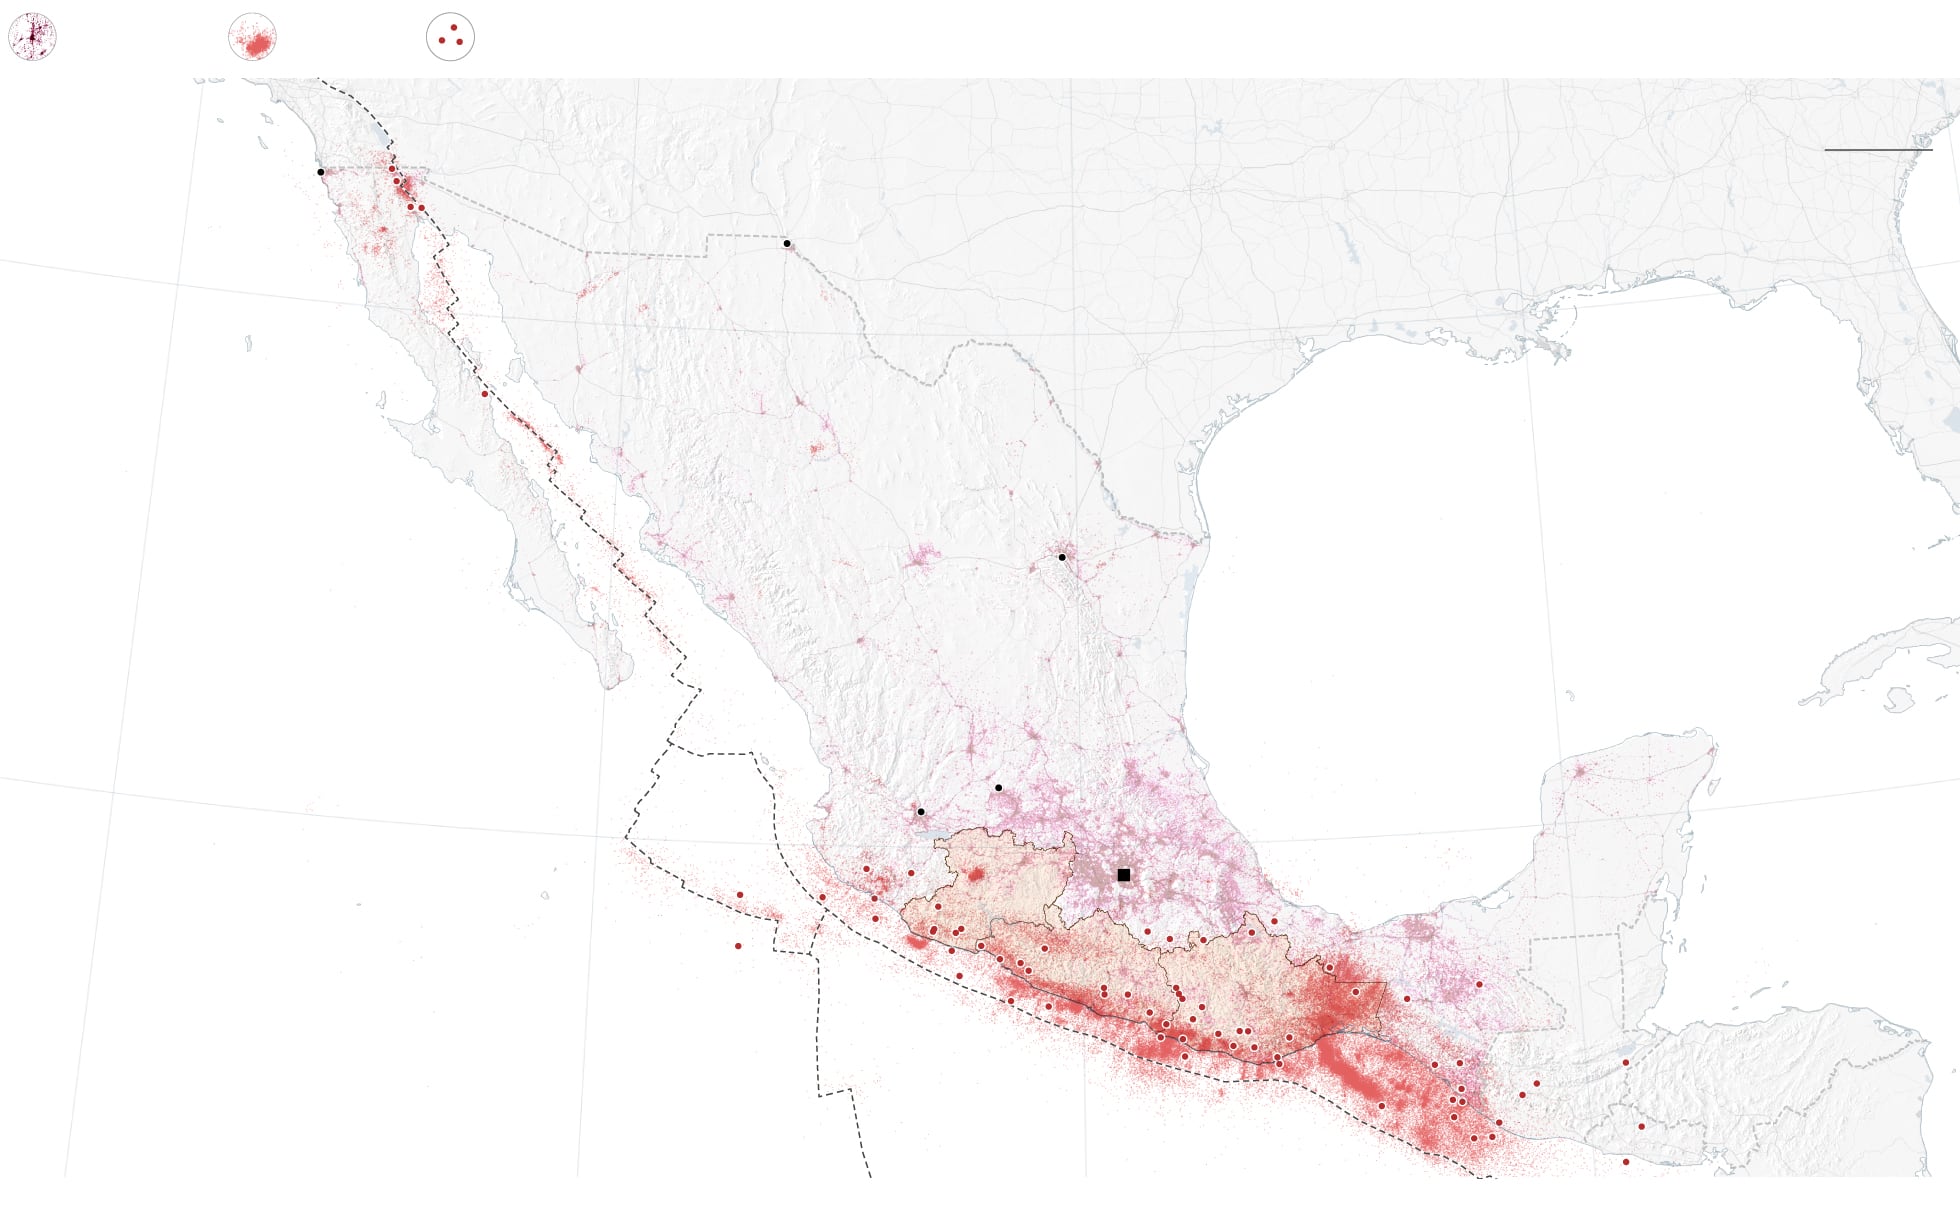
Población
Sismos
Sismos de gran magnitud (+7)
Estados
Unidos
200 km
Torreón
Monterrey
Placa
norteamericana
México
León
Ciudad de México
MICHOACÁN
Guerrero
OAXACA
Placa de Cocos
El Salvador
Los Estados de Michoacán, Guerrero y Oaxaca concentran el 80% de los terremotos producidos en el último siglo
200 km
Sismos de gran magnitud (+7)
Población
Sismos
Estados Unidos
Ciudad Juárez
Golfo de México
Torreón
Monterrey
Placa norteamericana
México
León
Mérida
Ciudad de México
MICHOACÁN
Guerrero
Océano
Pacífico
OAXACA
Guatemala
Belice
Placa de Cocos
El Salvador
Los Estados de Michoacán, Guerrero y Oaxaca concentran el 80% de los terremotos producidos en el último siglo
Sismos de gran magnitud (+7)
Población
Sismos
200 km
Tijuana
Estados Unidos
Ciudad Juárez
Golfo de México
Torreón
Monterrey
Océano
Pacífico
Cuba
Placa norteamericana
México
León
Mérida
Ciudad de México
Mar del Caribe
MICHOACÁN
Guerrero
OAXACA
Los Estados de Michoacán, Guerrero y Oaxaca concentran el 80% de los terremotos producidos en el último siglo
Guatemala
Belice
Placa de Cocos
Honduras
El Salvador
These maps were made with QGIS and Adobe Adobe Illustrator and were published through ai2html.
Conclusions
Until the moment of working on this article I had never used 3D software even though it was something that had always caught my attention. As in any field when you start is hard and making a simple diorama cost me more than planned but I learned along the way, I lost the fear of Blender and today is one of my favorite tools and I use whenever I have the opportunity.
What would you change today from the article? Two ideas come to my mind: the design, the composition of the diorama is designed for desktop and does not work on mobile. I would probably not mess around processing the batting data and would use the GEBCO data directly. They are fantastic and for the scale of the map it is more than enough resolution.
You can take a look at the article here.