Exploring the history of A Coruña through the construction years of its buildings
I recently discover a nice QGIS plugin named Spanish Inspire Catastral Downloader to download catastre data from the INSPIRE Services of Spanish Cadastral Cartography.
The plugin allows you to download a set of very accurate data both at parcel level and building.
It will download to your machine several sets of data in which you will find a layer named like Building Polygon that contains the building data. This layer has a field in it’s attribute table named end that contains the year in which that building was finished so you can get it with a basic field calculator manipulation.
This time I just make a series of sketches about A Coruña city and Colmenar Viejo town.
This map uses a quantitaive scale to assing the color ramp to the buildings years. So the black color is assigned to those buildings completed between the year 1860 and 1960, next color to 1960-1965 and so on.
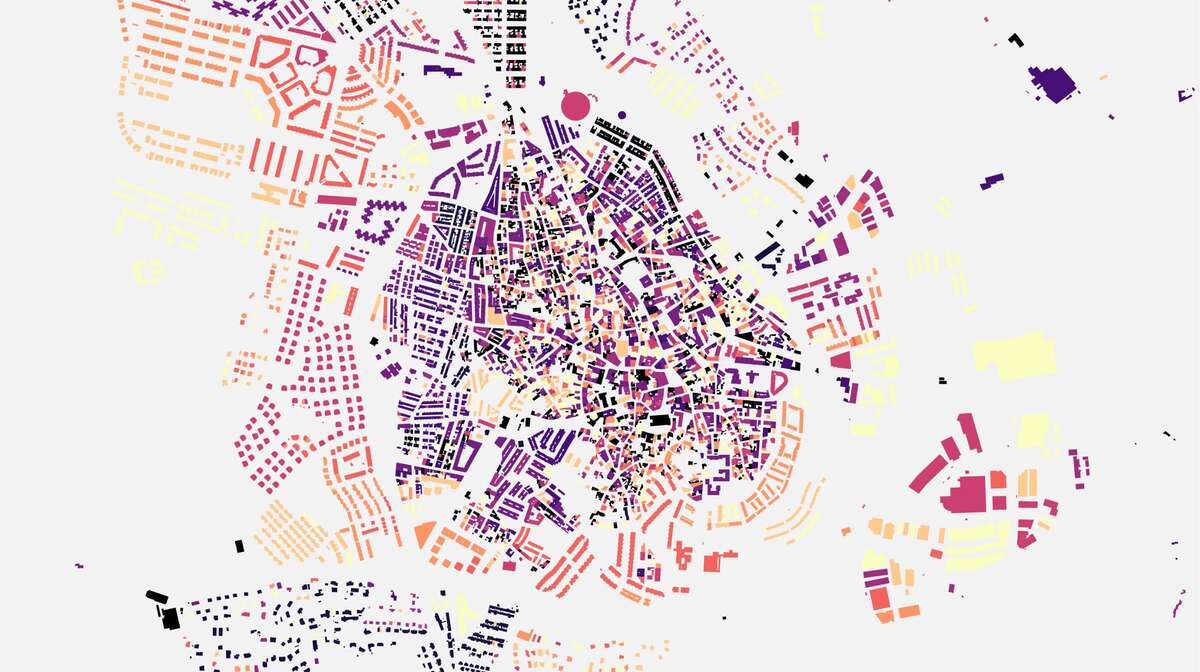 Colmenar Viejo, Madrid.
On the other hand, I did this other sketch from A Coruña city (below) where the color scale is assigned using decades: from 900 (year of the oldest building documented in the database) to 1910, from 1910 to 1920 and so on.
Since I live in this city, I have seen several times the map of the city rotated about 315º as it happens with the city of Barcelona. I suppose that since a large part of the city is located on a peninsula, it obeys to bring the idea of the city closer to how its citizens conceive it.
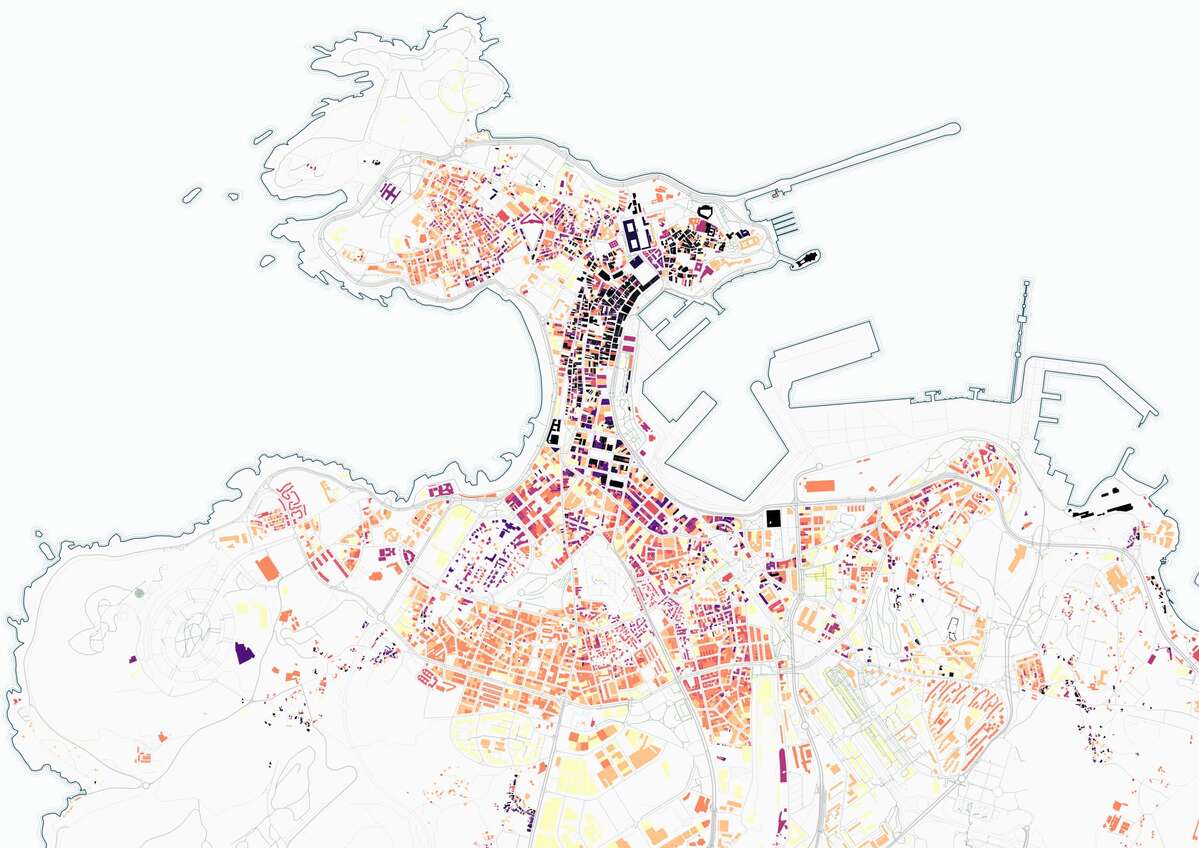 A Coruña city (the map is rotated 315º).
I added a layer of roads from OSM to give the map a bit more consistency.
Next image makes zoom to the older part of the city. The district of Pescadería (known as Fish Market) and La Ciudad Vieja (Old Town) the two oldest parts of the city. In the Fish Market district, specifically in the street of the Franja Street and Riego del Agua is where the original core of the city seems to be concentrated where even archaeological vestiges of Roman era have been found.
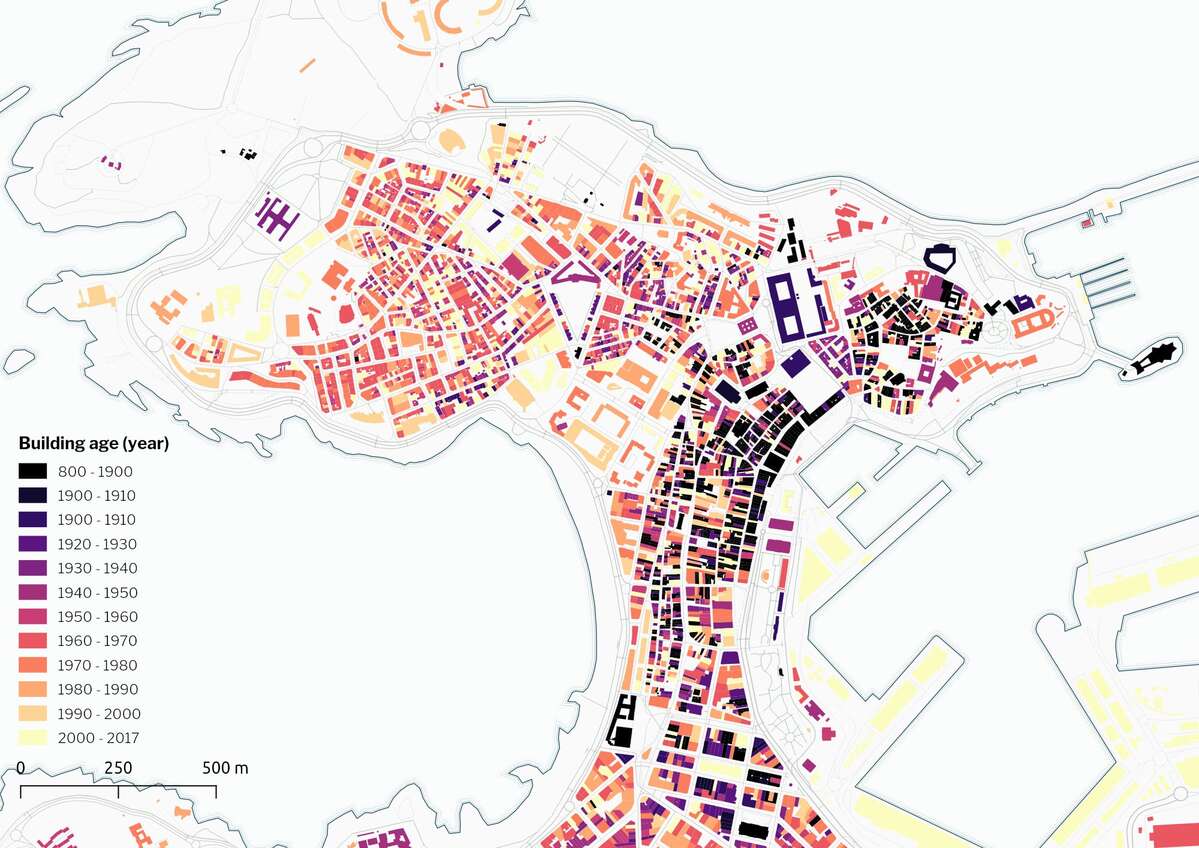 In black color the district of Pescadería and La Ciudad Vieja the two oldest parts of A Coruña.
But when you plot this dataset you quickly realize that there is probably a methodological error in the collection of the data or simply at some point some reports with approximate data were filled out.
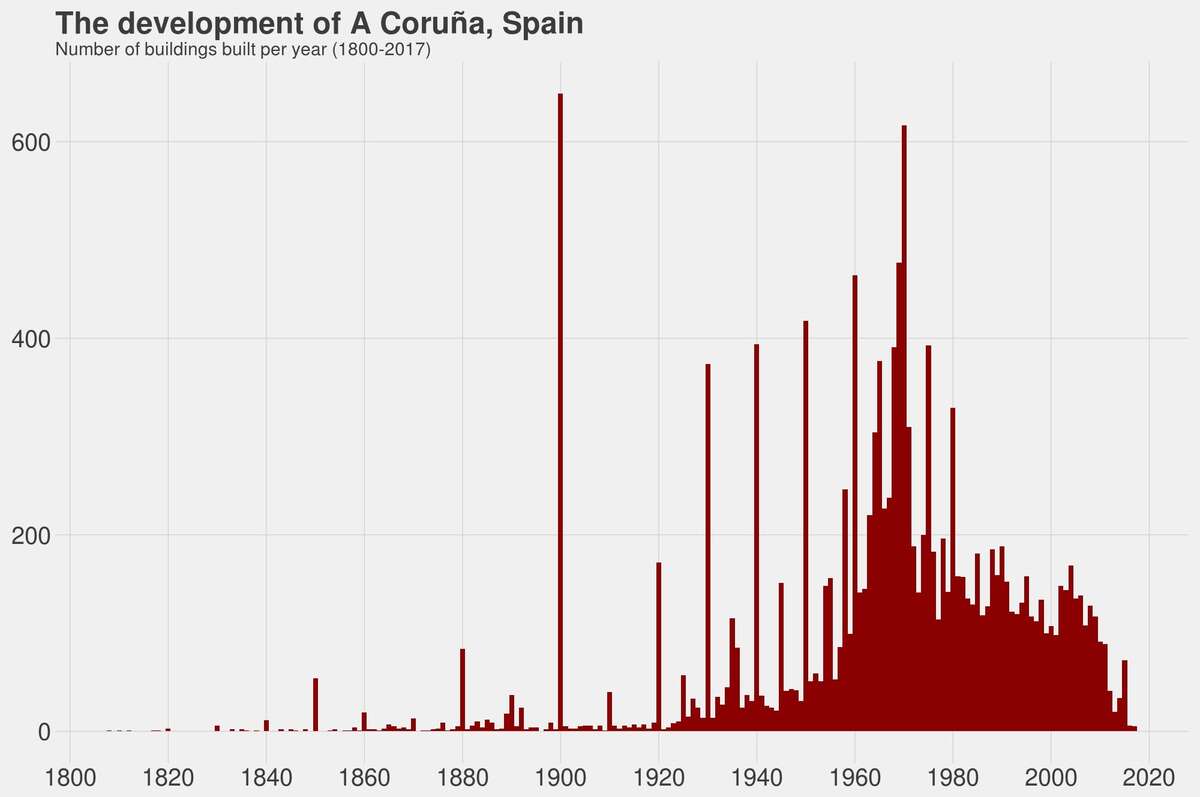 Plot in R with the development of the city. Using the wonderful theme_fivethirtyeight for it.
It seems a bit strange the number of buildings built in the year 1900 or the accumulation of buildings built in ‘rounded’ years (1920, 1930, 1935, 1940 and thereafter).
Plot in R with the development of the city. Using the wonderful theme_fivethirtyeight for it.
It seems a bit strange the number of buildings built in the year 1900 or the accumulation of buildings built in ‘rounded’ years (1920, 1930, 1935, 1940 and thereafter).