GIS should be a must in newsrooms
Last march I had the chance to participate in the 2016-2017 master in data driven journalism at Villanueva University. The idea was to teach basic concepts and ideas about GIS maps and journalism.
First day was a four hour workshop about how to make a static choropleth map using QGIS. The attendees would be able to make a population density map of Spain. To change coordinates system of a shapefile, merge shapefiles, create new fields on the Attribute Table, make a spatial join, apply a right color ramp, use the print composer, etc.
I toke the decision to make it all open source and share it on GitHub, so here is the repo (spanish).
For the rest of the course I prefered to use GitHub’s gist to share the steps and examples of each workshops. All the gist has its own exercises. Here are the more relevant days:
- QGIS Basic tags: layer properties panel, rule-based styles, etc. Link.
- Vector analysis: intersect, merge, clip, dissolve, buffers, etc. Link.
- Working with rasters, reading from csv, heatmaps, etc. link.
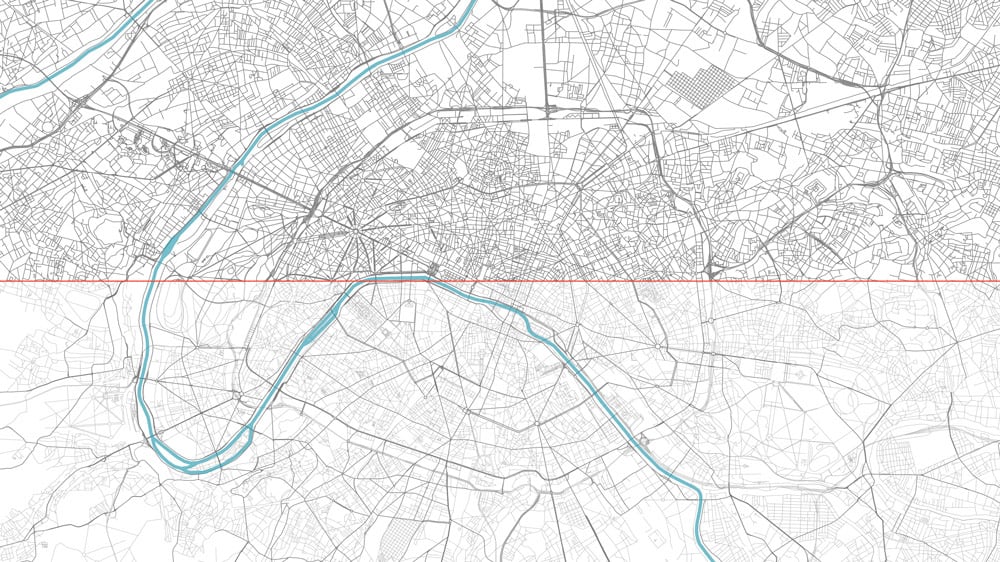 Capture from the lesson about how to use rule-based styles to customize the appearance of vector features.
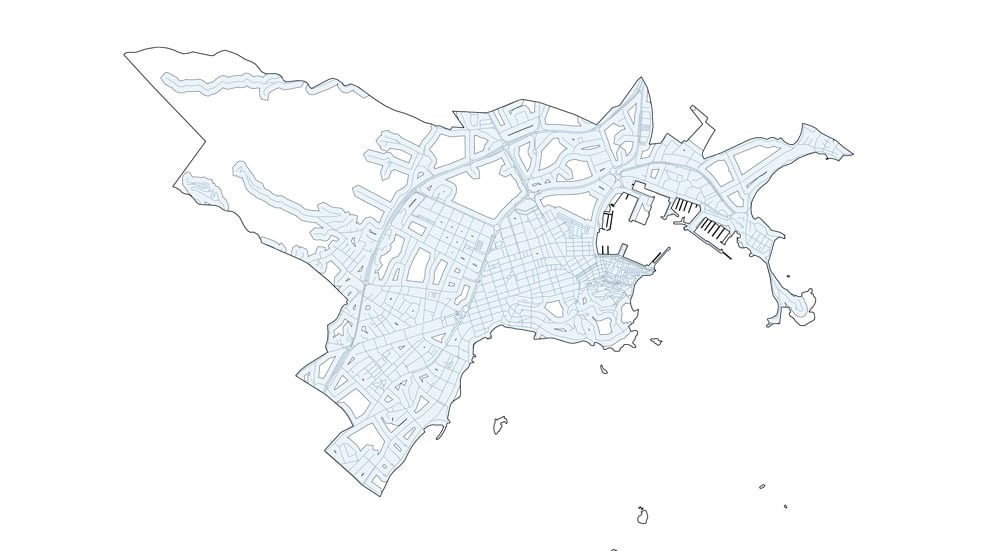 Capture from the lesson about how to use the basic algorythms of any GIS (buffers, clips, difference, etc.).
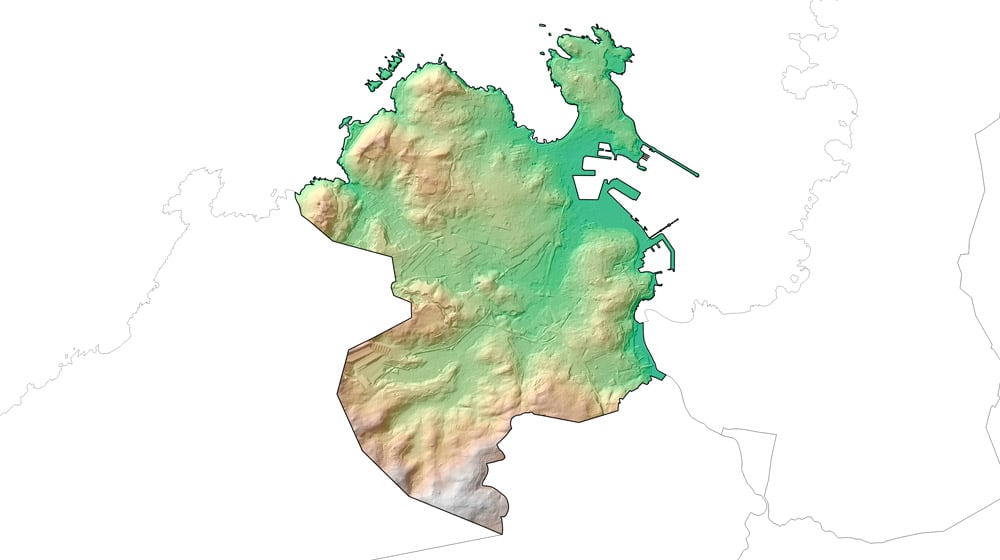 Capture from the lesson about how to work with raster data.