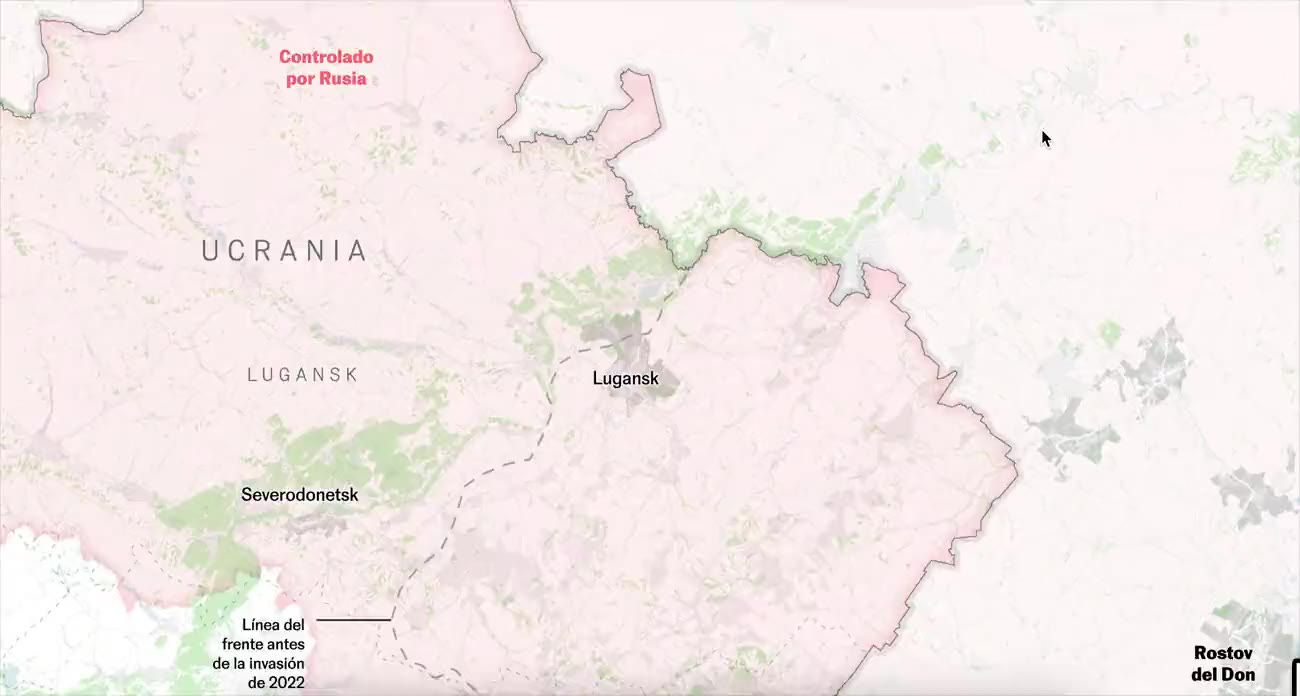
What Ukraine would lose by ceding occupied territory
Context
This explainer quantifies what is at stake in occupied Ukrainian territory by combining geography with strategic assets such as infrastructure, resources, and energy nodes. My contribution focused on cartographic clarity: simplifying a dense geopolitical topic into layered maps that readers can scan quickly without losing territorial detail.
My role
- Cartography
- Data analysis
I led the cartographic execution and narrative map design, translating a dense geopolitical context into layered visuals that remained readable without sacrificing territorial detail.
I worked in close editorial collaboration with Javier Galan, aligning map focus, available evidence, and story priorities throughout production.
Data and methodology
The piece was built around front-line mapping, strategic-asset context, and a four-step temporal introduction that helped readers understand how the situation evolved before entering the main map.
As in other conflict pieces on Ukraine, Gaza, and Lebanon, we combined newsroom analysis with field reporting inputs from correspondents when available.
Key decisions
- We chose an oversized vertical map as the core interface so readers could traverse the front in one continuous narrative path.
- The base was produced as a large ai2html export from QGIS, then enhanced with Intersection Observer and CSS-triggered annotations that appear progressively while scrolling.
- We prioritized guided reading and territorial orientation over decorative complexity, using annotations to reduce cognitive load on a high-density map.
Result
The final article combined a concise temporal introduction and a highly detailed vertical map that made military positions and strategic stakes understandable in a single scrollable experience.
Impact and learnings
- The story performed very well and helped establish a new visual format in Spanish media: a large, deeply detailed, vertically navigable conflict map.
- It validated this hybrid workflow (QGIS + ai2html + scroll-triggered annotation) as a strong model for future war-front explainers.