Data shows the extreme magnitude of Valencia's flood: it should only occur every 1,000 years
Context
This story contextualizes the Valencia flood through rainfall, flow, and inundation records to show how exceptional the event was in historical terms. I developed the map and visual framing so the statistical rarity and territorial impact could be read together, turning technical hydrometeorological data into an accessible public explanation.
My role
- Cartography
- Frontend development
I led the cartographic and visual implementation, focusing on a scrollytelling sequence built with Svelte and ai2html to make rarity and territorial impact readable together.
I was responsible for translating technical hydrometeorological evidence into a clear, device-agnostic visual narrative.
Data and methodology
The project was developed collaboratively across several team members, with parallel workstreams coordinated throughout production to keep the story coherent and compact.
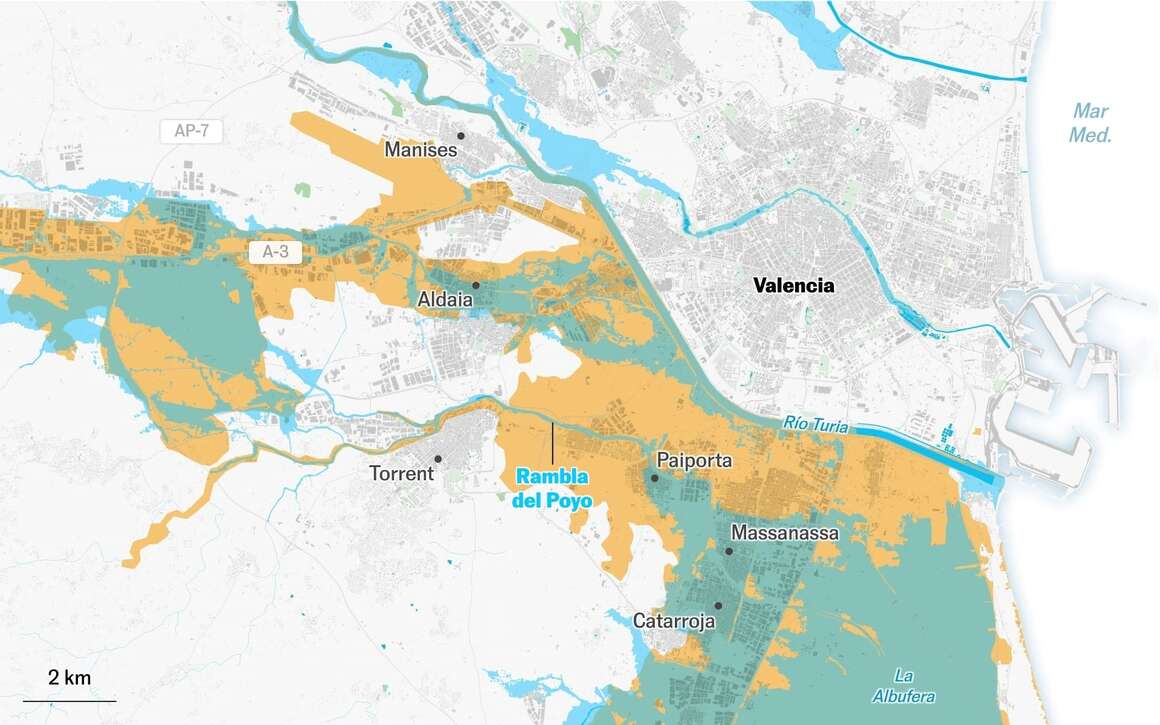
My section compared flood-prone scenarios by return period (10, 100, and 500 years) and then contrasted them with the real inundation footprint using Copernicus data derived from Sentinel-1 and Sentinel-2.
Key decisions
- We structured the narrative as a progressive scroll so readers could compare expected flood extents before seeing the observed event.
- Color scales, labels, and basemap design were tuned to maximize interpretability and avoid confusion between modeled probability layers and observed inundation.
- Cross-device readability was treated as a core requirement, with careful attention to typographic hierarchy, map simplification, and responsive behavior.
Result
The final piece made the extraordinary nature of the flood legible to a broad audience by connecting statistical rarity with concrete territorial consequences.
Impact and learnings
- The article had strong audience impact and became a reference explainer on the exceptional magnitude of the event.
- It also validated a coordinated team workflow where specialized visual modules can be built in parallel and integrated into one consistent story.