The coming floods: DANA, storms, and medicanes
Context
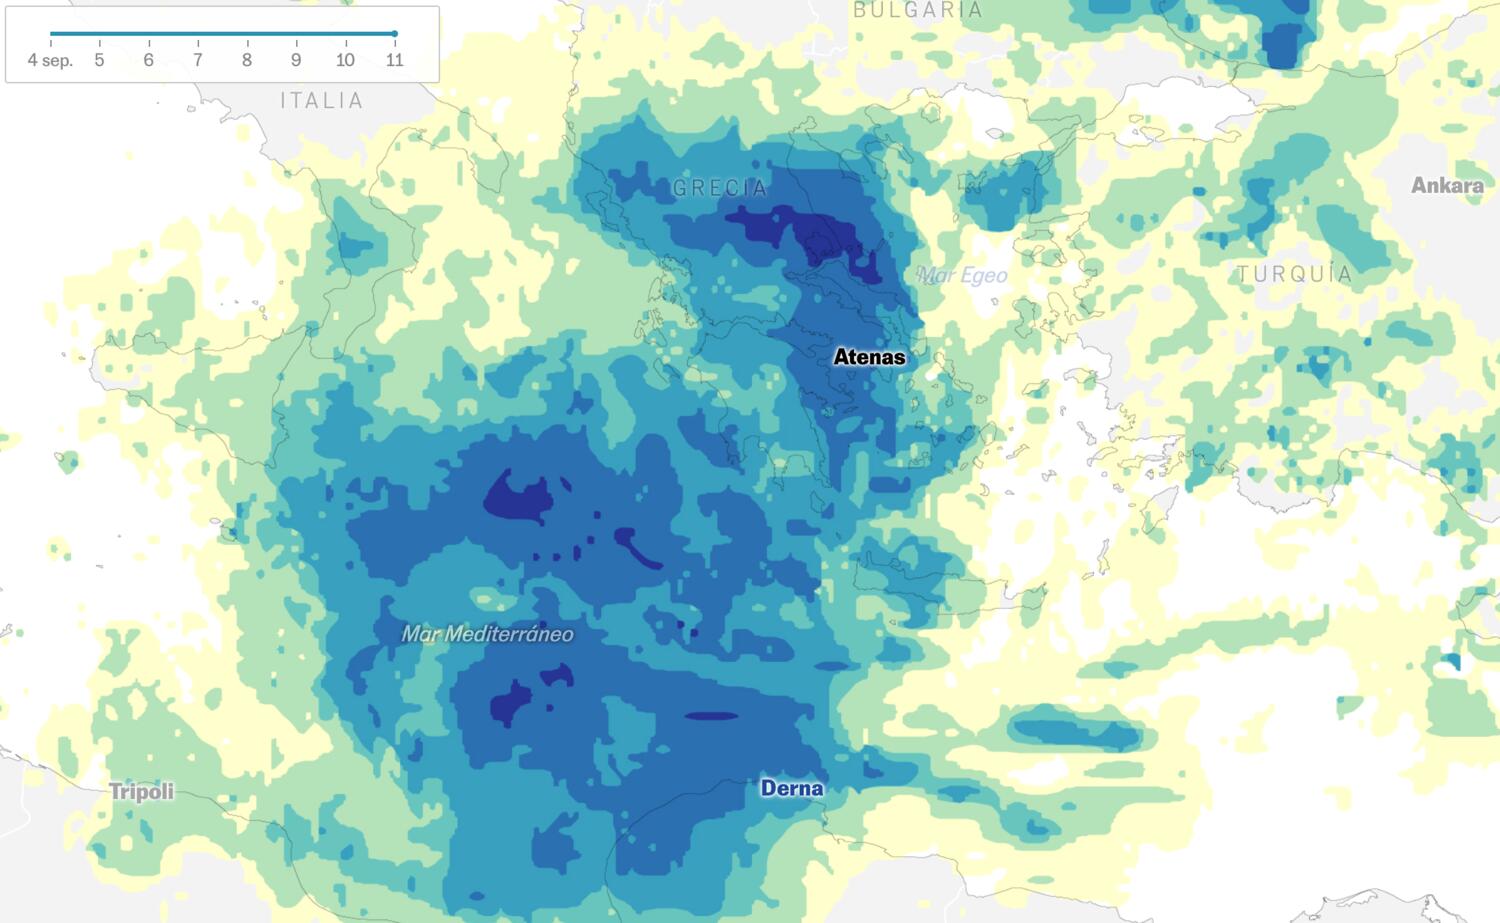
This explainer connects different Mediterranean storm systems—DANAs, cyclones, and medicanes—to show why recent flood events have become more destructive. I structured the narrative around comparative maps and annotated sequences so meteorological complexity remained understandable for non-specialist readers.
My role
- Frontend development
- Data analysis
- Cartography
I led the visual implementation and interactive narrative design, translating high-frequency precipitation data into a scroll-controlled video sequence for non-specialist readers.
Data and methodology
The story was developed in close collaboration with Laura Navarro, using EUMETSAT precipitation products (Blended SEVIRI / LEO MW) with 15-minute temporal resolution.
I extracted and processed the required dates and spatial resolution from EUMETView, then integrated the data into a narrative sequence anchored in Storm Daniel as a recent, high-impact case.
Key decisions
- We centered the explainer on a concrete and recent event (Storm Daniel) to frame broader atmospheric patterns in a way readers could immediately relate to.
- I implemented a vanilla JavaScript scroll-video interaction so users could control progression through the event timeline directly from reading behavior.
- The design prioritized clarity: a readable legend, explicit color-scale meaning, and a synchronized timeline that advanced with video playback.
Result
The final piece combined comparative meteorological explanation with a controlled visual reconstruction of a real event, balancing scientific detail with accessible storytelling.
Impact and learnings
- The project was a technical milestone because it was my first production scrolly-video implementation.
- It validated this format as a strong way to explain dynamic weather processes while keeping readers oriented in time and space.