The 100-meter sprint and the end of timeless records
Context
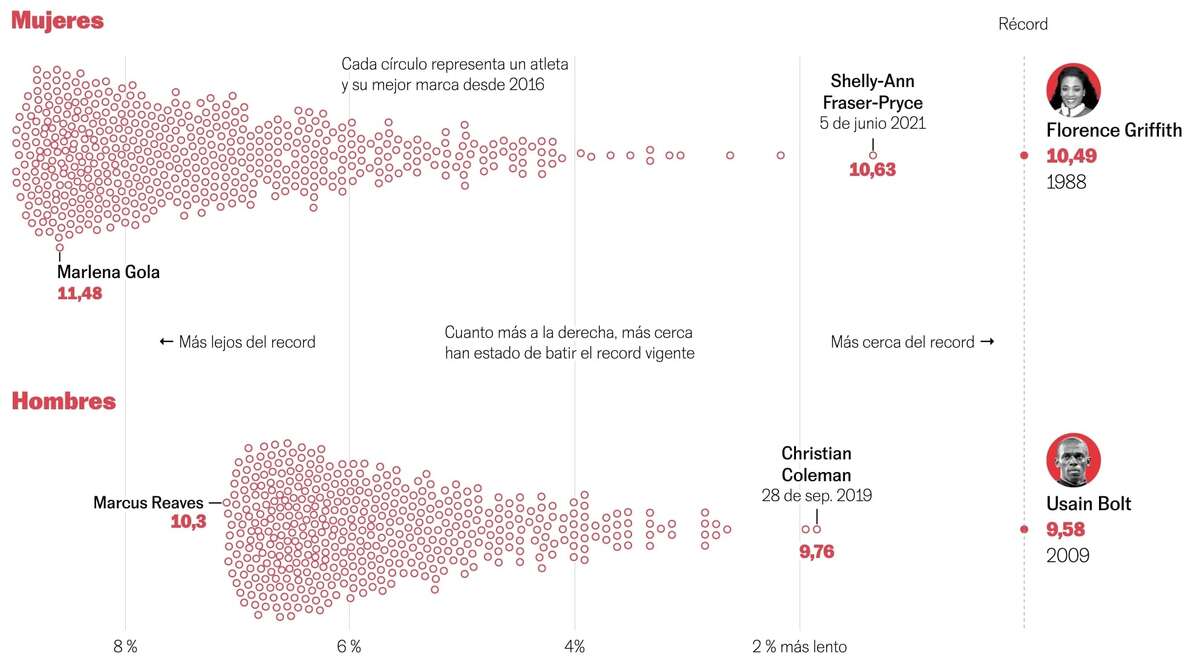
A performance analysis of elite 100-meter sprint records, comparing historical marks, era effects, and current competitive ceilings. I designed the visual framework to make long-term trends and outliers readable at a glance while preserving statistical context.
My role
- Data analysis
- Data visualization
I designed the visual framework to make long-term trends and outliers legible at a glance while preserving statistical context and historical continuity.
Data and methodology
The charts were developed in D3, then exported as SVG assets and enriched with ai2html annotations to increase narrative depth in the published version.
The workflow combined quantitative comparison with explanatory layering so readers could move from raw marks to historical interpretation.
Key decisions
- I prioritized a clean and restrained visual language to avoid noise and keep attention on temporal patterns in performance.
- Color palettes were deliberately limited and carefully tuned to separate eras and highlight exceptional records without overemphasis.
- Annotation was added after chart construction to provide context without breaking the underlying statistical structure.
Result
The final piece offered a concise historical tour of the 100-meter event, balancing analytical rigor with newsroom readability.
Impact and learnings
- It was a valuable collaboration with the sports desk and expanded my range into a topic area I do not usually cover.
- The project reinforced a reusable hybrid workflow (D3 + SVG export + ai2html annotation) for narrative statistical explainers.