Paiporta under water: reconstructing a deadly flood
Context
An in-depth reconstruction of the Paiporta flood based on field evidence, witness testimony, and measured water marks across dozens of locations. I helped structure the visual methodology: mapping observed heights, cross-checking locations, and building a coherent spatial narrative that made the scale of the event concrete and verifiable.
My role
- 3D recreation
- Data analysis
- Cartography
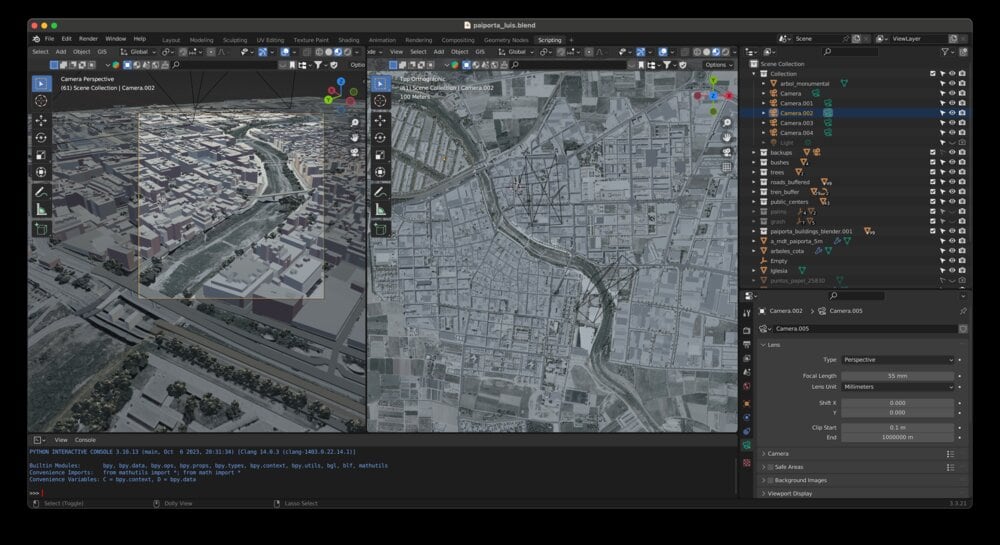
I was responsible for the 3D reconstruction workflow: translating flood-height data into spatial surfaces, rebuilding urban context from available sources, and producing the final visual output for publication.
I worked with Blender to model the built environment, used geometry nodes to emulate vegetation, and introduced controlled randomization to improve realism and spatial readability.
Data and methodology
Days after the flood, Borja Andrino collected hundreds of on-site water-height measurements across affected municipalities to document the maximum reach of the event.
We interpolated those values, overlaid them on a real digital terrain model, and iterated reconstruction tests until the modeled flood extent and depth aligned with observed evidence and testimonies.
Because several areas were not fully mapped in OpenStreetMap, we combined official cadastre sources with manual 3D reconstruction to approximate urban morphology at usable editorial quality.
Key decisions
- We structured the story around specific locations and first-hand testimonies to connect technical reconstruction with lived experience.
- The reconstruction was rendered as video and embedded in a scroll-driven narrative format to guide readers through the progression of impact.
- We prioritized fidelity and legibility over perfect geometric completeness, choosing an approximate but robust city model that supported explanatory goals.
Result
The final piece delivered a high-detail reconstruction of the flood peak and made the scale of inundation physically understandable for readers through a guided visual narrative.
Impact and learnings
- The project had strong editorial impact and offered one of the first broadly accessible reconstructions of what happened during the most critical hours of the disaster.
- It established a repeatable workflow for combining field measurements, terrain analysis, and 3D cartographic storytelling in extreme-event reporting.