The power of remote sensing and its application to the media
Context
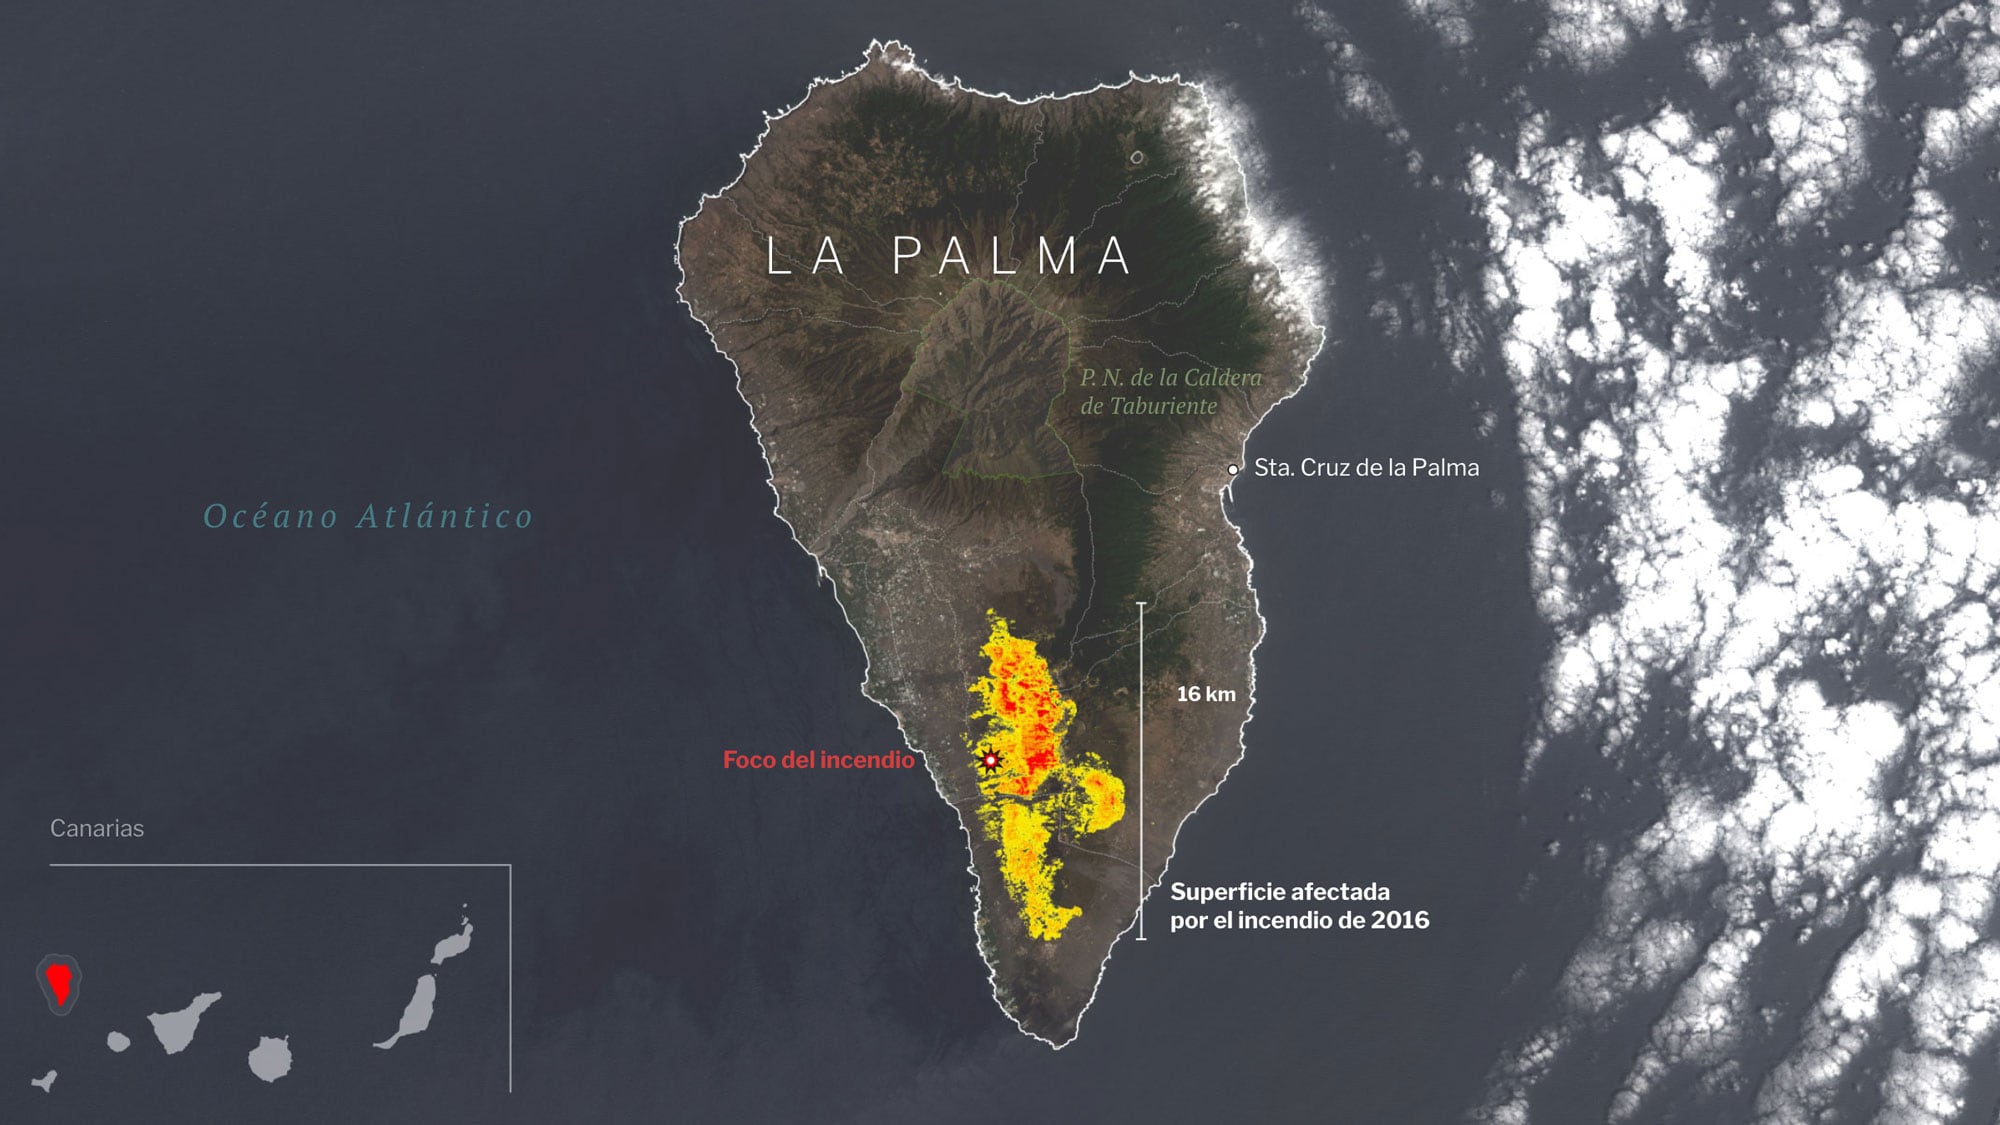
A remote-sensing reporting project applying the Normalized Burn Ratio (NBR) to measure wildfire impact with Landsat 8 imagery in two Iberian cases: La Palma and Donana.
My role
- Data analysis
- Cartography
- Frontend development
I led the geospatial analysis and translated satellite-derived burn metrics into publishable graphics for general audiences.
I produced the map outputs and responsive embeds used to explain severity and spatial extent in both case studies.
Data and methodology
I combined Landsat 8 scenes from pre-fire and post-fire dates, then calculated NBR to estimate burn severity changes.
The workflow drew on NASA documentation, academic references, and QGIS's Semi-Automatic Classification Plugin for preprocessing and raster operations.
Key decisions
- Waited for post-fire imagery availability before publishing comparisons to avoid speculative damage estimates.
- Used two real fire events to test whether the same remote-sensing method held up across different landscapes.
- Packaged outputs as responsive ai2html graphics so complex raster analysis remained readable on mobile and desktop.
Result
The project delivered two evidence-based wildfire explainers with reproducible satellite analysis steps.
Impact and learnings
- It demonstrated that newsroom teams can use remote-sensing indices as practical reporting tools, not only academic methods.