The Zamora and Leon wildfire, one of Spain's largest
explainer
stack: [qgis, ai2html, remote sensing]
Context
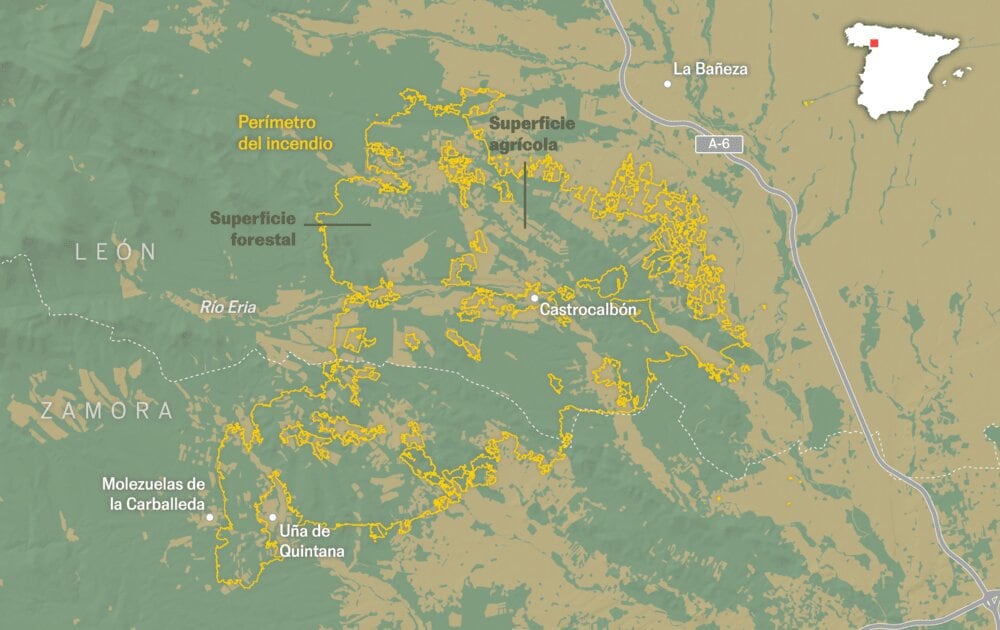
A map-based explainer of the Zamora and Leon wildfire, focused on burned-area measurement and how agricultural and forest surfaces are counted.
My role
- Cartography
- Data analysis
- Frontend development
I worked on the geospatial analysis and visual implementation of the story.
Data and methodology
The analysis combined EFFIS perimeter data, Sentinel-2 imagery, and additional processing to separate burned and unburned areas inside the fire boundary.
We compared agricultural and forest categories to place the event within Spain's historical large-fire records.
Key decisions
- We highlighted the difference between near-real-time perimeter estimates and audited burned forest area.
- We used simple maps and charts to explain why the same fire can produce different total-hectare readings.
- The visual flow moved from local fire details to national seasonal context for easier interpretation.
Result
The final piece provides a clear explanation of the wildfire's scale and measurement limits.
Impact and learnings
- The project supports consistent wildfire coverage by connecting operational data with readable public context.