Hormuz under threat: tanker traffic and chokepoints
Context
This project was produced as a breaking-news explainer to clarify, in one fast-reading visual piece, what a potential Strait of Hormuz blockade implies for oil and gas flows.
My role
- Cartography
- Data analysis
- Frontend development
I handled the cartographic narrative, shipping-data interpretation, and frontend integration, with a priority on clear messaging under severe time pressure.
Data and methodology
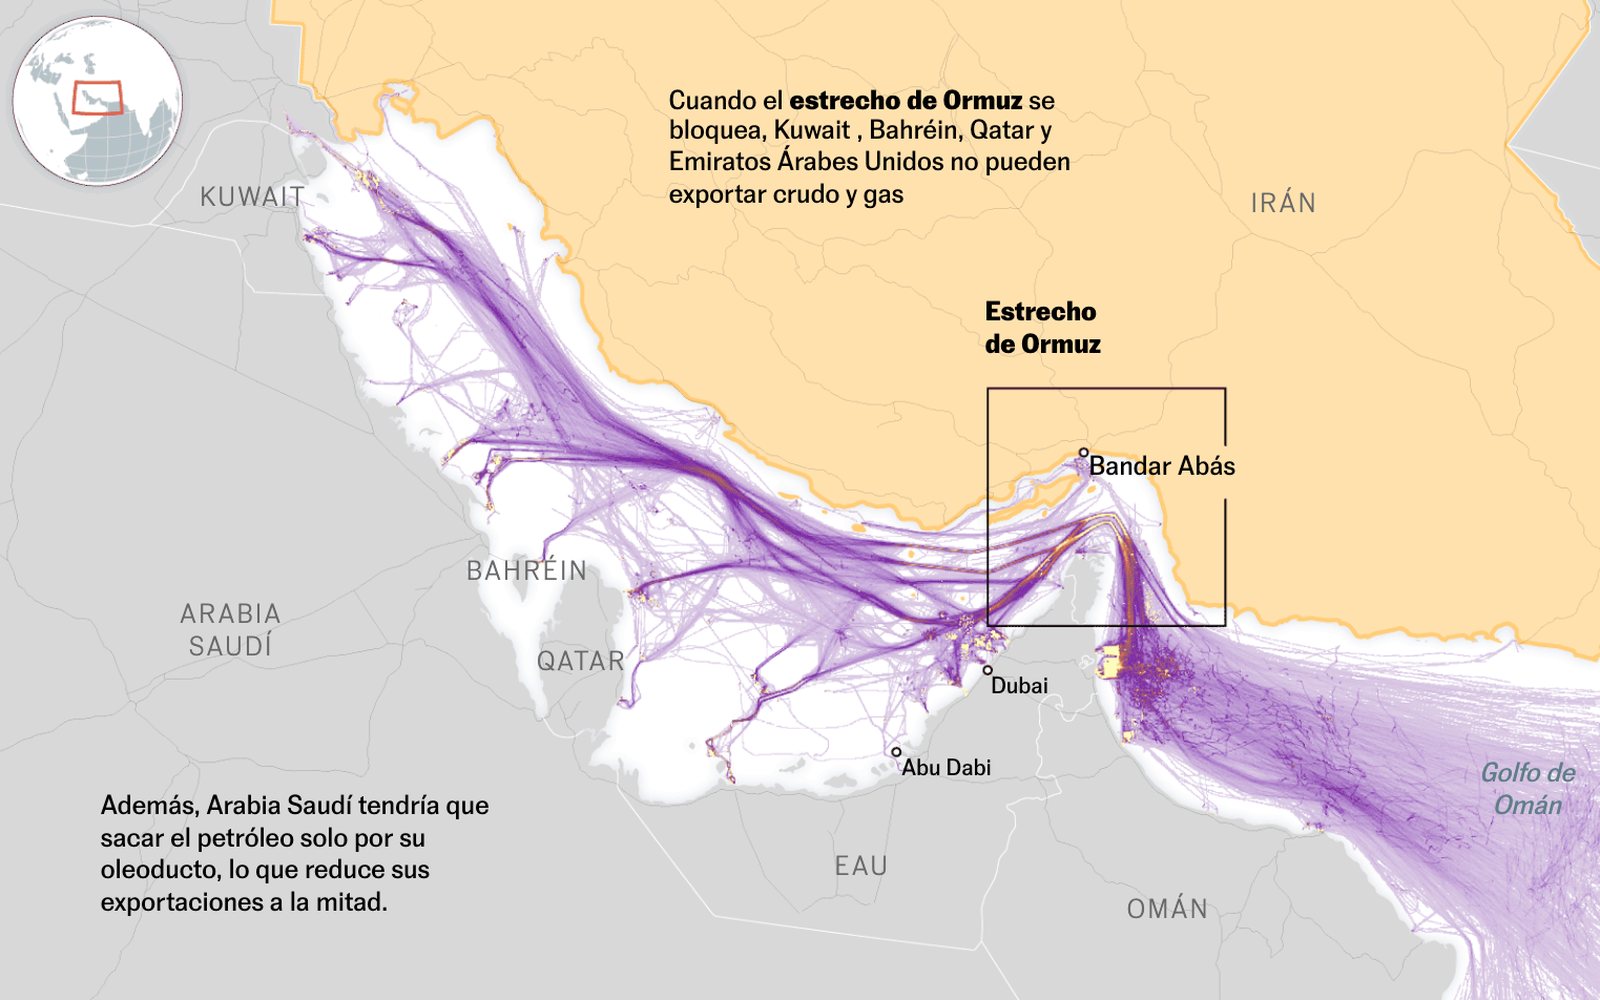
I combined vessel-track density with geographic bottleneck framing to show where maritime risk concentrates and how traffic redistributes when threats increase.
The story was built and published within a 24-hour breaking-news cycle, balancing analytical depth with production speed and mobile readability.
Key decisions
- I prioritized a direct map-first structure so readers could immediately understand the choke point and its regional dependencies.
- Annotations were kept concise and strategically placed to connect route patterns with concrete export consequences for Kuwait, Bahrain, Qatar, UAE, and Saudi Arabia.
- Visual hierarchy was simplified to preserve clarity on small screens while still showing high-density maritime movement.
Result
The final piece translated a complex geopolitical risk into an accessible map narrative that explained both local bottlenecks and broader energy implications.
Impact and learnings
- The project reinforced a repeatable 24-hour workflow for high-stakes geoeconomic explainers where speed, clarity, and geographic precision are equally critical.