How to Merge CSV headers in R. An approach
Context
A practical tutorial on cleaning statistical CSV files with multi-row headers in R using tidyverse workflows. It is based on recurrent public-data formatting issues and focuses on reproducible steps that can be reused in day-to-day reporting pipelines.
My role
- Data analysis
I designed and documented a reusable R solution for a recurring data-cleaning problem: combining multi-row headers into consistent machine-readable column names.
Data and methodology
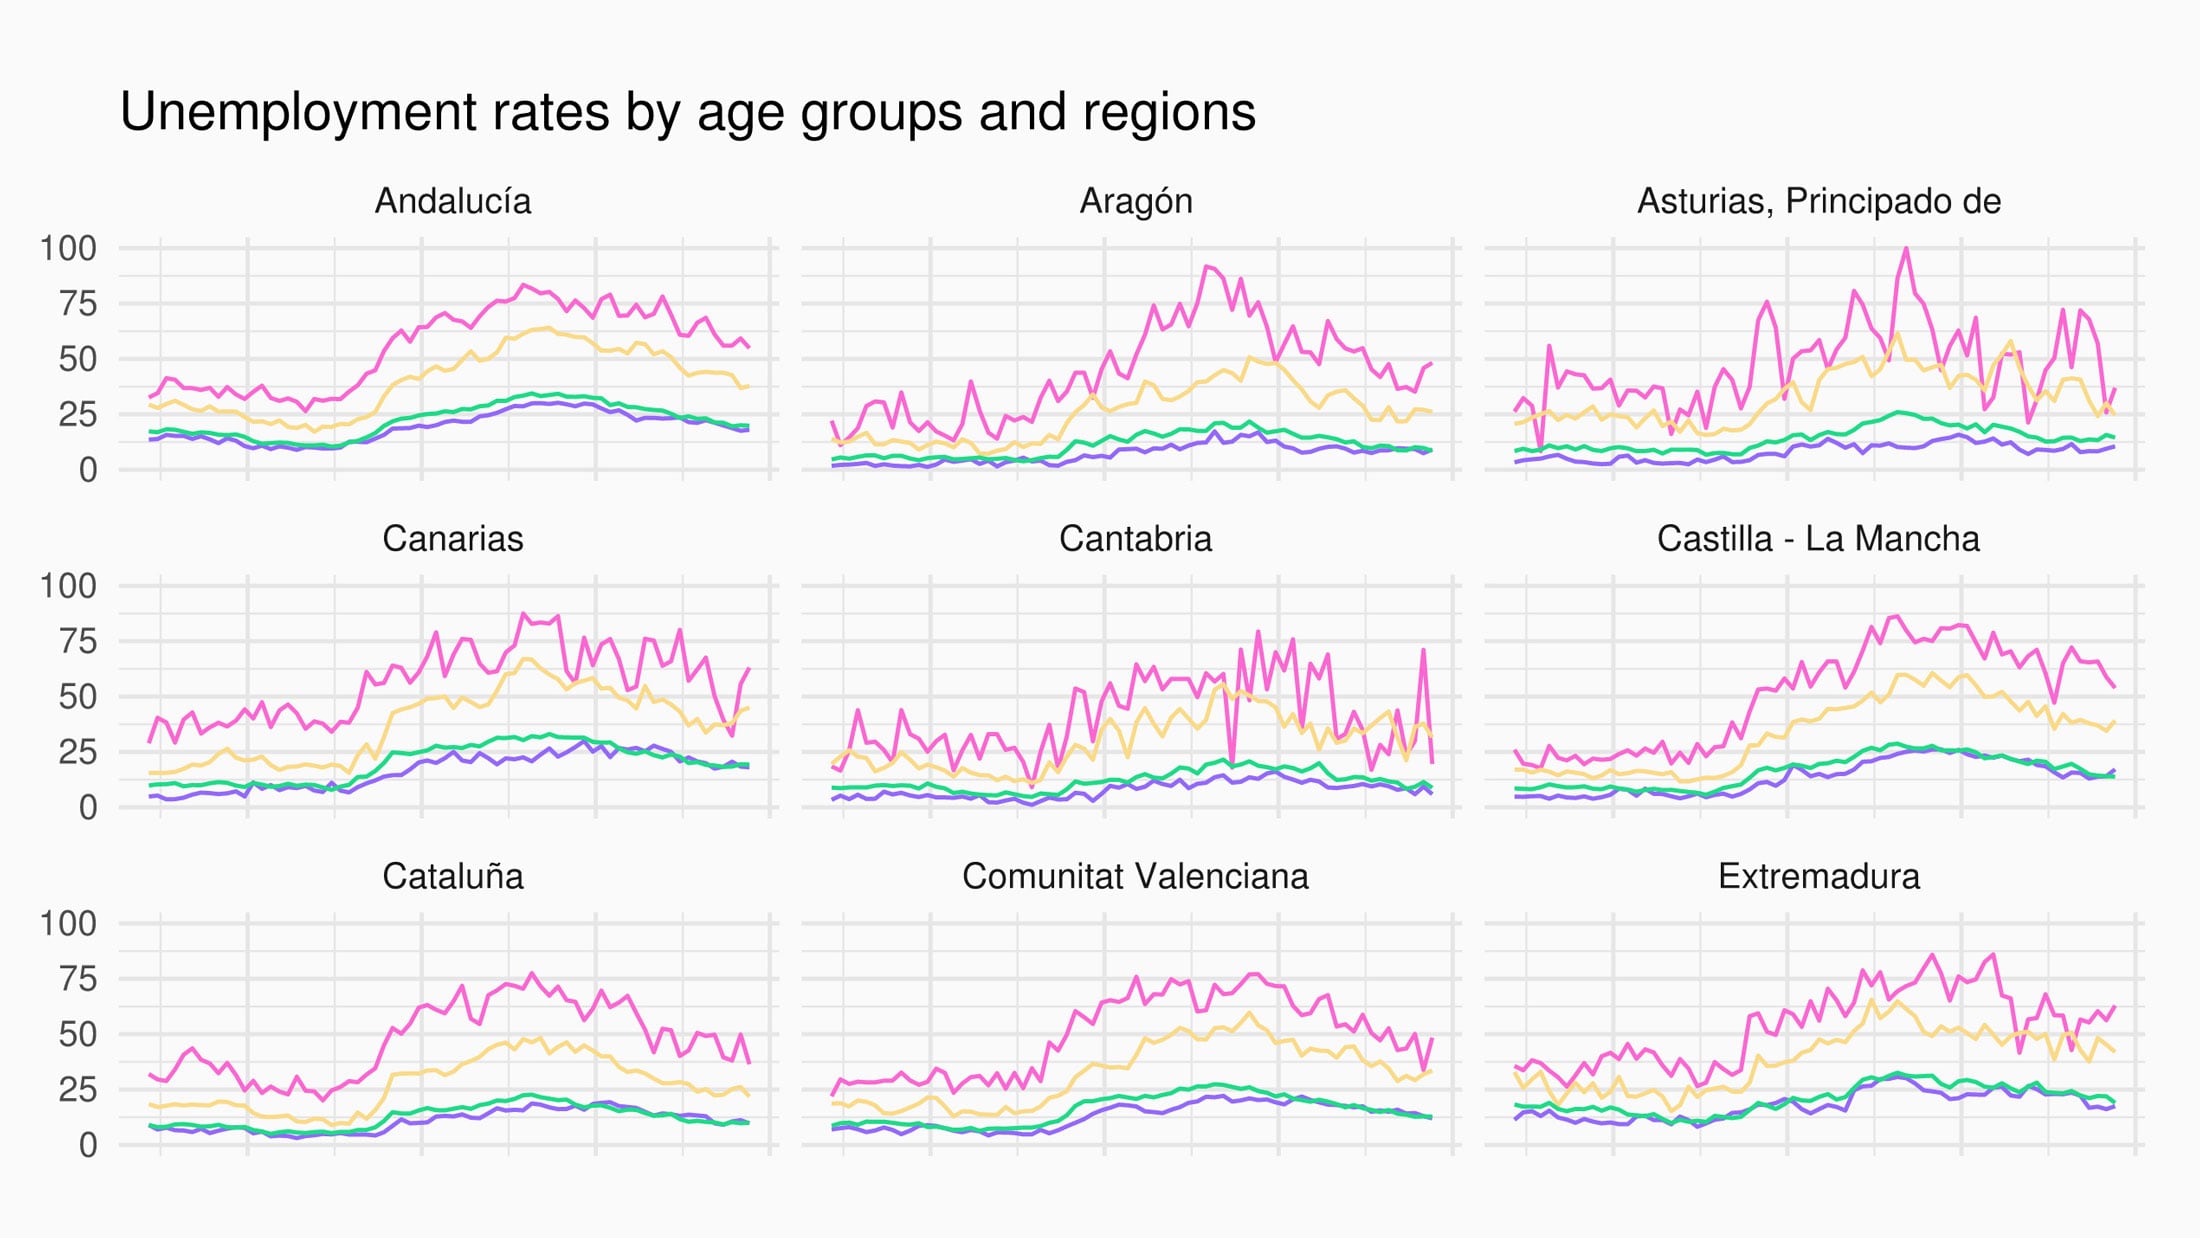
The workflow starts from the original XLSX file (instead of an early CSV export) to preserve metadata context, then reads the table with readxl and skips non-data preamble rows.
I implemented a custom function, combineHeaders, to merge hierarchical header rows (for example age group + quarter) into normalized field names joined by underscores.
After header normalization, the pipeline removes empty rows and columns, reshapes to long format, parses temporal fields into dates, and produces ready-to-plot analytical output.
Key decisions
- I prioritized reproducibility over manual spreadsheet edits, so every transformation could be rerun and audited.
- The process keeps metadata visibility early in the workflow and postpones simplification until after structural cleanup.
- I chose a clear didactic sequence (raw input -> header merge -> tidy table -> plot) to make the method transferable to similar public datasets.
Result
The final output demonstrates a complete end-to-end transformation from non-usable official spreadsheet structure to tidy data and a publishable ggplot visualization.
Impact and learnings
- The project became a practical reference for handling malformed statistical tables in day-to-day reporting workflows.
- It reinforced the value of small custom utilities in R when common package defaults do not solve newsroom-specific data formats.