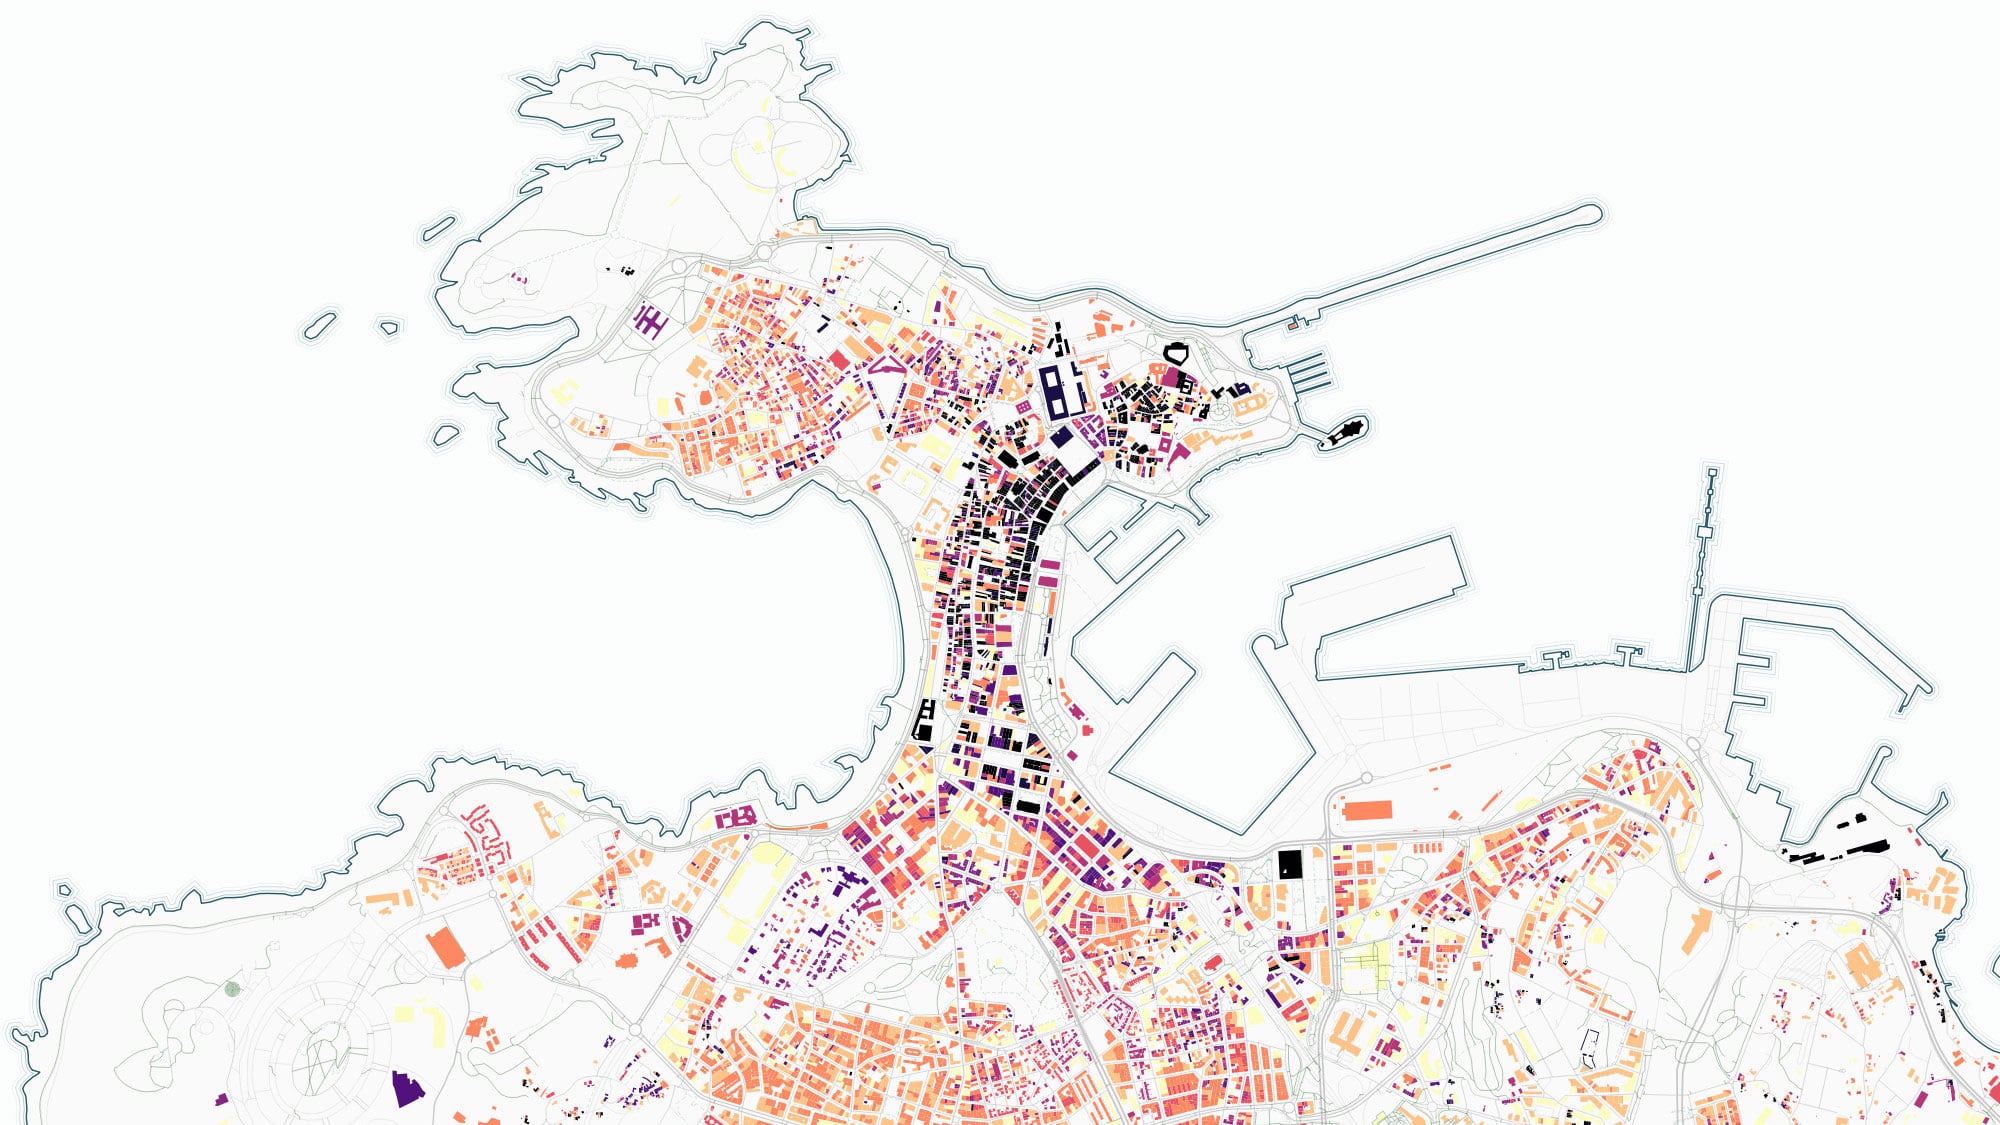
Exploring the history of A Coruña through the construction years of its buildings
Context
This project explores urban history in A Coruna and Colmenar Viejo using Spanish cadastre building data downloaded through the INSPIRE Catastral Downloader plugin for QGIS.
My role
- Data analysis
- Cartography
- Frontend development
I prepared and styled the cadastral building layer, using the `end` attribute as a proxy for building completion year.
I produced map sketches, rotated the A Coruna view to match local spatial conventions, and ran R checks to inspect temporal distributions.
Data and methodology
I compared two temporal classification strategies: a quantitative scale with narrow bins and a decade-based scheme from the oldest records onward.
I added OSM roads for orientation and created detail views of Pescaderia and Ciudad Vieja to read early urban cores.
Key decisions
- Used two color-binning approaches to test how classification changes the historical narrative of the same dataset.
- Rotated A Coruna around 315 degrees to align the map with how residents commonly perceive the peninsula layout.
- Flagged suspicious spikes in rounded years (for example 1900, 1920, 1930) as likely data quality artifacts instead of treating them as ground truth.
Result
The final maps reveal long-term growth patterns and oldest districts while making data uncertainty explicit.
Impact and learnings
- The work shows how open cadastral data can support local historical storytelling when paired with careful validation.