The center of the world crumbles like a cookie
Context
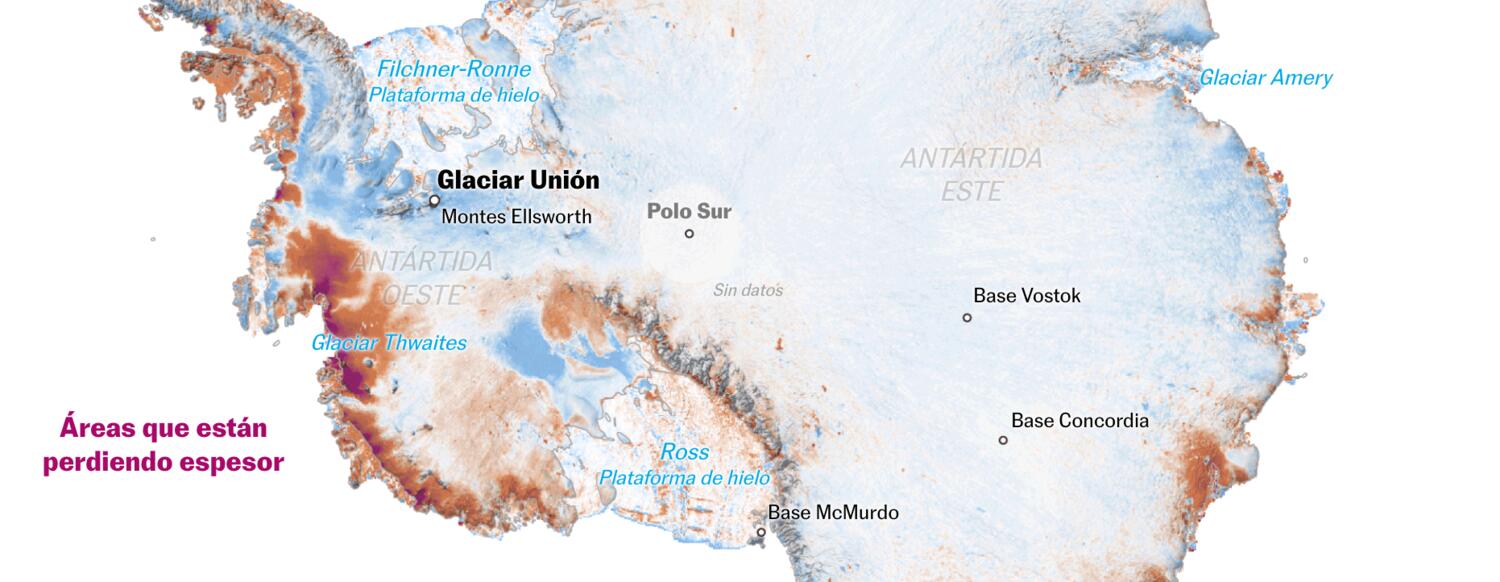
A long-form visual piece on Antarctic ice loss built from ICESat-2 satellite data and a Spilhaus-based cartographic approach. I processed and generalized geospatial data, converted it into storytelling layers, and integrated custom graphics to explain where ice is thinning or gaining mass and why those patterns matter at planetary scale.
My role
- Data analysis
- Cartography
- Frontend development
I designed and implemented the geospatial narrative, turning scientific ice-elevation data into a readable public-facing story with both static and interactive cartographic layers.
I worked on data preparation, map design, and the technical integration needed to combine projection logic, derived datasets, and final web visuals.
Data and methodology
The project started from collaboration with science reporters and field context from a Chilean mission in Antarctica, then translated those reporting goals into a map-first narrative structure.
We used NASA ICESat-2 (ATL15) data in NetCDF format and processed it in R to compute mean change values, aggregate raster detail, polygonize results, extract centroids, and export datasets for visualization.
Key decisions
- We adopted the Spilhaus projection concept to place Antarctica at the center of the story and frame oceans as one connected system.
- Because this projection was not practical to implement directly in QGIS, we moved the final globe logic to D3 while keeping QGIS and R in the preprocessing workflow.
- We prioritized legibility across devices by combining dense analytical processing with simplified visual layers and explanatory annotation.
Result
The final piece merged scientific context, projection-based storytelling, and data-derived cartography into an accessible explanation of Antarctic ice dynamics at human and planetary scales.
Impact and learnings
- The project expanded our newsroom workflow for handling raw Earth-observation data and converting it into robust visual journalism outputs.
- It also validated a hybrid pipeline (R + QGIS + D3 + ai2html) that can be reused for future climate and geospatial investigations.