358,000 hectares in 15 days: how Spain burned during its darkest weeks
explainer
stack: [qgis, ai2html, remote sensing]
Context
A map-based explainer about Spain's 2025 wildfire peak, focused on burned area, territorial concentration, and short-term air-quality effects.
My role
- Cartography
- Data analysis
- Frontend development
I worked on data processing, map production, and visual integration for the story.
Data and methodology
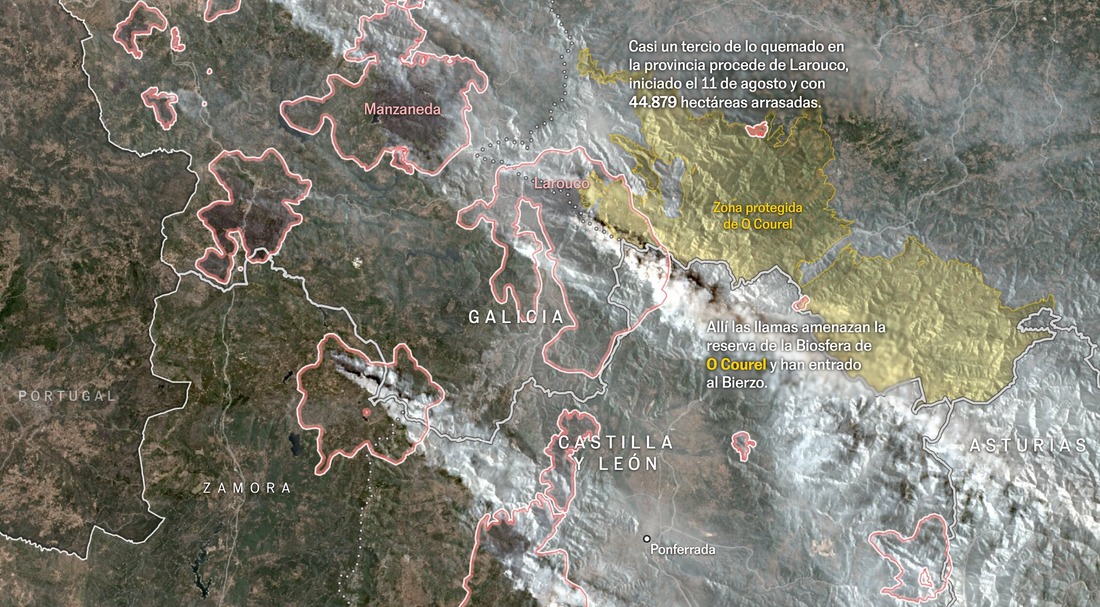
The analysis used EFFIS wildfire perimeters, Sentinel-2 imagery, and European Environment Agency air-quality data.
We combined fire perimeters with administrative boundaries to compare regional and provincial impact over time.
Key decisions
- We prioritized recent-week context to show the speed and scale of the August surge.
- We used simple map and chart modules to connect burned area, geography, and air-quality change.
- The visual structure kept comparisons straightforward at national, regional, and EU levels.
Result
The final piece provides a clear snapshot of Spain's most critical wildfire period in 2025.
Impact and learnings
- The project supports a repeatable workflow for rapid wildfire monitoring and public-facing map explainers.