How I covered Spain's 2019 general elections for RTVE
Context
A full election coverage package developed with Datadista for RTVE around Spain's 2019 general election. In the weeks before voting day we published deep analysis of 2016 results, then updated every module with final 2019 outcomes.
My role
- Data visualization
- Frontend development
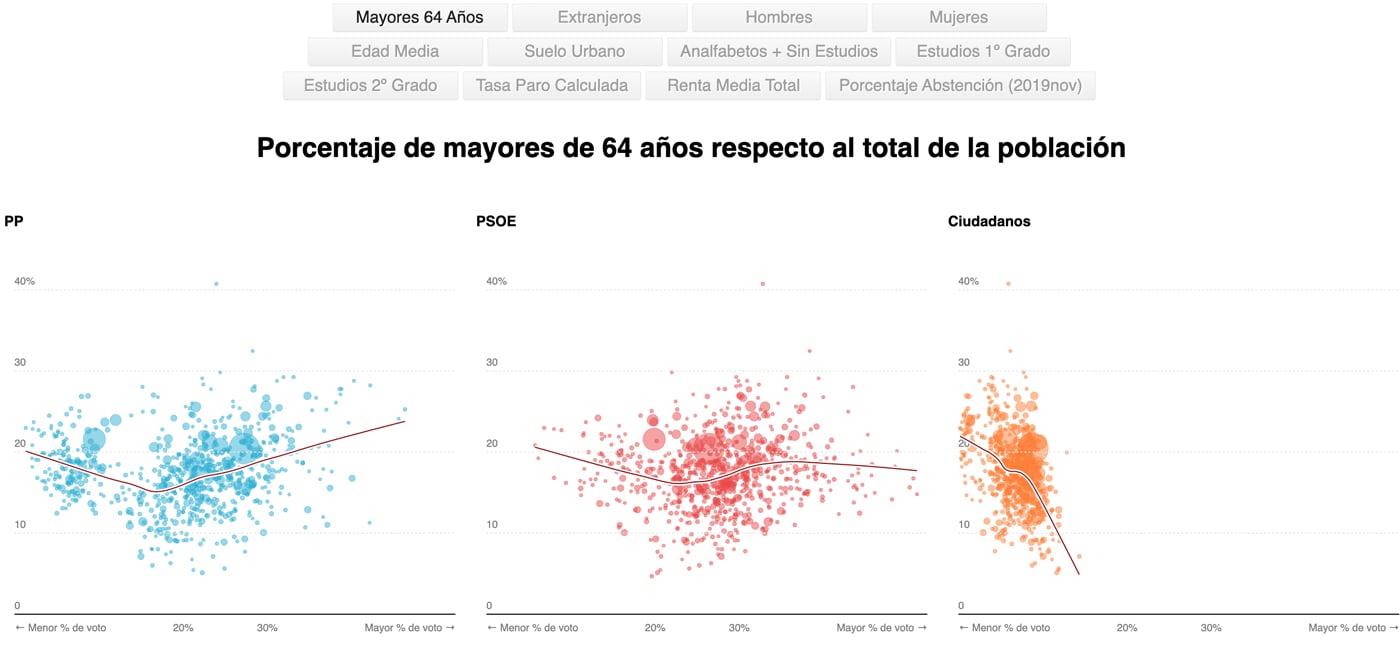
I built the front-end visual pieces with D3, including scatterplots, maps, treemaps, and a cartogram workflow based on Joseph Bailey's geogrid package in R.
I also handled interaction and rendering decisions for high-density views, such as combining Canvas and SVG in scatterplots with more than 800 points per panel.
Data and methodology
The project mixed historical and live reporting: first a pre-election reading of past cycles, then a fast update pass after election night.
Each visual module answered a different editorial question: voter profile scatterplots, winner maps by municipality, cartograms, treemaps of seat cost, and small-multiple maps of bipartidism decline.
Key decisions
- Used d3-delaunay for fast point interaction in scatterplots without a hidden Voronoi layer.
- Related election winners to population density to avoid misleading area-based readings of Spain's sparsely populated territory.
- Adopted quantile and power scales in map legends to communicate highly uneven distributions.
Result
RTVE published the package as an interactive election hub that supported both exploratory reading and quick headline interpretation.
Impact and learnings
- The work strengthened a reusable election graphics stack for large public audiences under real-time newsroom pressure.